So you have deployed VMware NSX into your lab or Production and you may be thinking to yourself “okay now what?” The next step you want to take is to validate your installation to ensure everything is running correctly. This task can be somewhat daunting if you are new to NSX and are not familiar with what is going on “behind the scenes” within the NSX environment.
The procedure is somewhat lengthy so I am going to jump straight into it for you. First and foremost, let’s take a look at the NSX lab environment that I have deployed. Here is a high-level diagram of my lab environment…INITECH.

There are three (3) clusters in my lab. The Management Cluster will provide resources to my vCenter Server Appliance (w/ External PSC), the NSX Manager and the NSX Controllers. The Edge Cluster will provide resources to the Edge and DLR Control VM’s. Lastly my compute cluster will provide resources to my 3-Tier Application virtual machines…TPS Reports. 🙂
Other important factors to make note of regarding the lab environment….
- VCSA 6.0 U2 (Build 4541948)
- NSX 6.2.4 (Build 4292526)
- ESXi 6.0 U2 (Build 3620759)
- All ESXi hosts are configured with two 10GbE uplinks; each vmnic is assigned to a dvUplink on the corresponding vDS as depicted above.
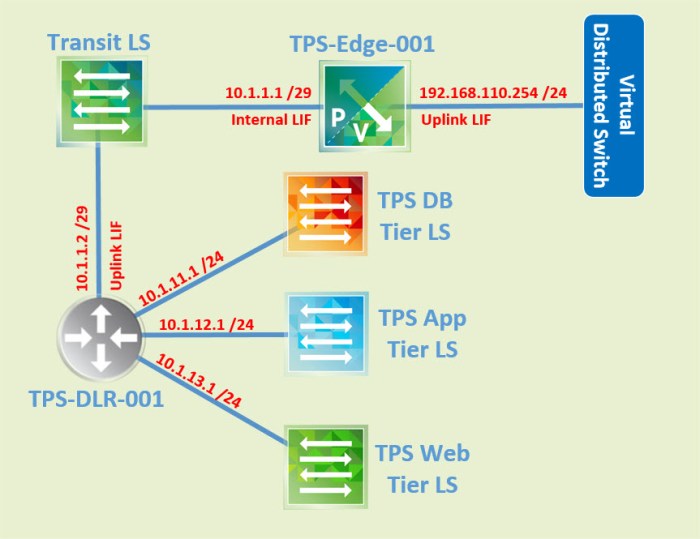
The 3-Tier TPS Application consists of four (4) virtual machines. A single back-end DB server, a single application server and two (2) front-end web servers. Each tier is connected to it’s own NSX logical switch. Below is a logical diagram of the NSX components that supports the 3-Tier application. Very basic NSX environment, nothing too fancy.
IMPORTANT: Some basics that you want to verify prior to this validation procedure would include ensuring DNS and NTP is properly configured. Verify both forward and reverse name resolution and double check all of your NTP settings (NTP source, time zone, etc.). You want CONSISTENCY!
Four (4) Validation Phases below….
Validation Phase 1 – vCenter and NSX Manager
The first step we want to take here is verify my NSX Manager is communicating directly with my vCenter Server. Keep in mind I have an external PSC. This part of the procedure is used to ensure proper NSX Management plane functionality.
- Log into the NSX Manager Appliance via web browser:
https://<IP-address-or-FQDN-of-NSX-Manager>/
- Next you will select the Manage vCenter Registration option.

- You will see settings for the Lookup Service URL and vCenter Server. If they are configured correctly they will have a GREEN DOT and ‘Connected’ indication next to Status. Green dot GOOD…Red dot BAD!

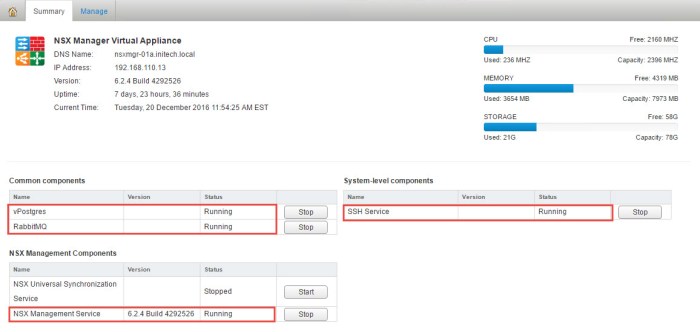
- Click the ‘Summary’ tab and verify the following services are running…vPostgres, RabbitMQ, NSX Management Service and SSH Service.
- Log into the vSphere Web Client and open Licensing. Select the ‘Assets’ tab and then select ‘Solutions.’ Verify that your NSX environment is licensed and ready to go.

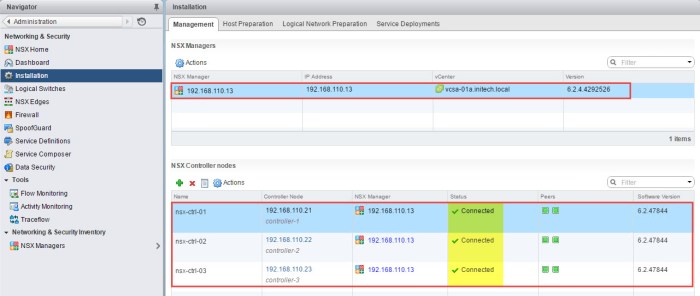
- Next open Networking & Security from within the vSphere Web Client. Select Installation and then the Management tab. Here you will see your NSX Manager (including IP address, vCenter Server associated and Version). Below the NSX Manager you will see a list of the NSX Controller (nodes). Each will have an IP address (likely from an IP Pool), status should say ‘Connected’ (with a green check mark), each controller should have two (2) peers and lastly the software version is displayed.
Installation > Management - Next select the Host Preparation tab and expand each of the Clusters & Hosts below. Each cluster should have a green check mark for Installation Status, Firewall and VXLAN.

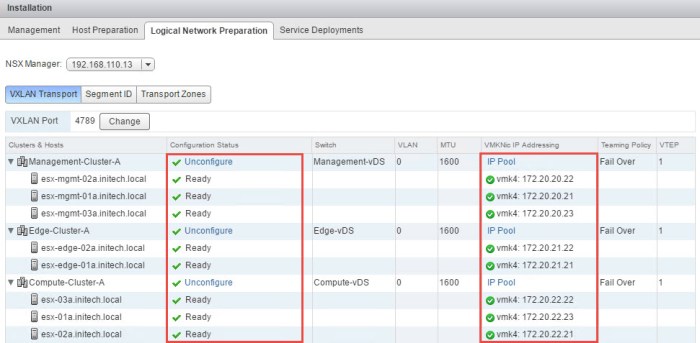
Installation > Host Preparation - Next select the Logical Network Preparation tab, VXLAN Transport should be chosen by default…expand the Clusters & Hosts. Each of the hosts should have a Configuration Status of Ready and a VTEP VMkernel (likely acquired from a VTEP IP Pool configured on the NSX Manager).
Installation > Logical Network Preparation > VXLAN Transport - Select Segment ID. The VXLAN Segment ID pool (aka VNI segments) will be listed. The ID pool I chose was 5000-5999. I obviously will NOT have that many VNI’s in my lab but what you will realize is the massive number of segments that NSX can create for your environment. I’m not using Multicast addresses because my Transport Zone is configured for UNICAST. Multicast addresses are only required for Hybrid or Multicast transport zones.

Installation > Logical Network Preparation > Segment ID - Next select Transport Zones and you will see a list of the Transport Zone(s) here. I only have one zone for my lab and it is configured for UNICAST. All of the vSphere Clusters that you want to participate in this NSX deployment should be part of the Transport Zone.
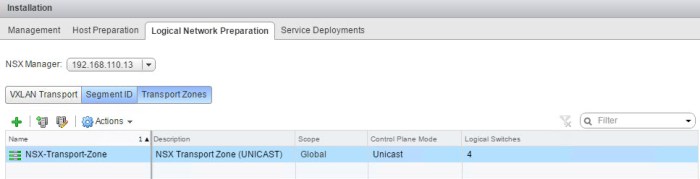
Installation > Logical Network Preparation > Transport Zones
NOTE: If you are looking for a better understanding of the Transport Mode types (Hybrid, Unicast and Multicast) take a look at the Replication Modes for Multi-Destination Traffic section from page 25 to 30 of the NSX Design Guide (PDF) available from VMware here.
Validation Phase 2 – NSX Manager CLI
Here we are going to execute a few commands on the NSX Manager appliance via SSH session (Putty). Make sure the SSH Service is running on the NSX Manager.
- Console to the NSX Manager appliance (via IP address or FQDN).
- First take a look at the management interface of the appliance. Make sure this IP addresses matches the IP address seen in the vSphere Web Client.
show interface

- Next lets look at the capacity of the local drives (there should be two). Ensure there is always enough free space.
show filesystems

- Now see the list of NSX Controllers including IP addresses and status. The state of each controller (3) should be RUNNING. The IP addresses should be identical to the IP addresses seen in the vSphere Web Client.
show controller list all

- Next we will take a look at the CLUSTERS being managed by NSX. Lets start with the following command…
show cluster all
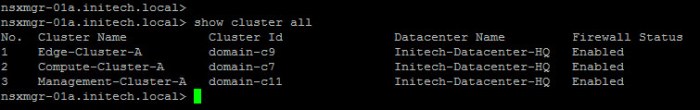
The ‘Cluster Id’ is important as you will use it in other commands versus the actual Cluster Name. So get use to using this command in order to locate the Cluster ID of a particular cluster (as you will see in the next step). The ‘Firewall Status’ column is a good indicator that the distributed firewall (aka DFW) is operating correctly. Micro-Segmentation won’t work right without it! 🙂 - Next, let’s take a look at the ‘Compute-Cluster-A’ as seen above. In this case we need to look specifically at ‘domain-c7’ and not the actual name of the cluster.
show cluster domain-c7

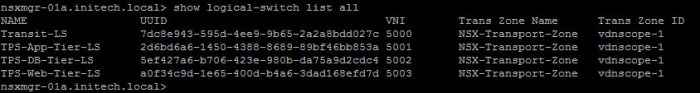
Here we will be provided a list of the ESXi hosts associated with this particular cluster as well as each hosts’ installation status. Each host should be ‘Enabled’ here. The ‘Host-Id’ information is also important when looking for particular information about a host; the actual FQDN or IP address of the host is not used in the command-line. You must know how to find the Host-Id for your hosts. - The next command is used to look at some information about the Logical Switches. This command will provide info regarding the Name, UUID, VNI and Transport Zone info about the logical switch.
show logical-switch list all
- Next take a look at the logical router(s). Here we are going to see one (1) logical router listed. Notice this is the DLR (Distributed Logical Router) and not the Edge router instance. The command below will display info such as Edge Id, Vdr Name, Vdr Id and the number of LIFs (Logical Interfaces) on the router.
show logical-router list all

- Next execute the following command to view the Edge (Perimeter) router instance. This command will display the Edge ID, Name, Size of the control VM, version and status. Notice both the Edge Gateway and DLR are both listed here.
show edge all

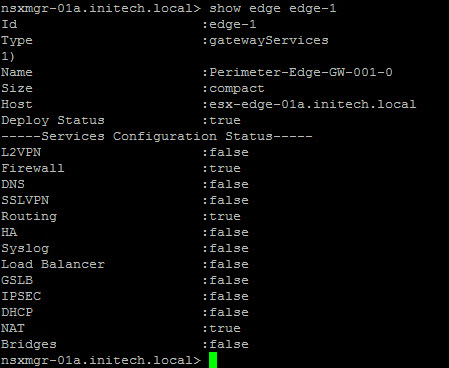
If you want to dive deeper into the router settings for a broader status summary:show edge edge-1
Validation Phase 3 – NSX Control Plane
In this section we are going to execute a few commands on the NSX Controllers to validate control plane functionality. For each controller command…execute the command on each controller separately so you can visually see the differences between the outputs.
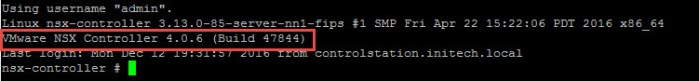
- Open a console session (SSH) with each of the three (3) NSX Controllers. After connecting to and authenticating with the controller you will immediately see the NSX Controller version and build number.
- Run the following command to display disk usage, memory usage and uptime of the controller.
show status

- The next command will display not only the local controller status but the five (5) roles performed by the cluster. All five roles should have a status of ACTIVATED. The cluster ‘Join status’ should indicate that it is complete. You will also see the Cluster ID and Node UUID. The Cluster ID has the Node UUID of the first controller deployed.
show control-cluster status

Controller-1 
Controller-2 
Controller-3 - The next NSX controller command displays whether or not a controller is listening for a particular role.
show control-cluster connections

NOTE: The ‘persistence_server’ role (server/2878) is listening on only one (1) of the three (3) controller nodes. Use this command to locate which of the three controllers currently owns this role. - The next command displays all three (3) controllers by their IP addresses. Each controller IP (likely acquired by a Controller IP Pool) will be listed.
show control-cluster startup-nodes

- The new command is used to display which controller is responsible for a specific VNI. Execute the following commands on each controller. The controller IP address listed to the right of the VNI ID is the responsible controller.
show control-cluster logical-switches vni 5000
show control-cluster logical-switches vni 5001
show control-cluster logical-switches vni 5002
show control-cluster logical-switches vni 5003

The output from this command will be pertinent to the command executed in the next step. - Based on the command above you will see that Controller-1 (192.168.110.21) is responsible for VNI 5001. So I will execute the following command on Controller-1.
show control-cluster logical-switches vtep-table 5001

The IP address above and the MAC address are associated with the VTEP VMkernel adapter on that particular ESXi host. From the vSphere Web Client, reference Networking & Security -> Installation -> Logical Network Preparation -> VXLAN Transport and expand each cluster to display the ESXi hosts and their VTEP IP addresses. From this table I am able to determine that the IP address 172.20.22.23 is associated with the ESXi host ‘esx-01a.initech.local’ in my Compute-Cluster. I am able to verify that information above by locating the VMkernel on that particular host in the vSphere Web Client.

- The next two commands are used to MAC and ARP table information. If the commands return no information (blank output) then the VM associated with that VNI (Logical Switch) are not powered on.
show control-cluster logical-switches mac-table 5001
show control-cluster logical-switches arp-table 5001

The output from the first command displays the MAC address of the VM(s) attached to VNI 5001 (NSX logical switch) and the IP address of the ESXi hosts VTEP IP address. This is the host running the VM and providing the connection. The output from the second command displays the IP address, MAC address and connection ID for that particular virtual machine.
Validation Phase 4 – NSX Data Plane (ESXi hosts to NSX Components)
In this section we are going to execute a few commands on the ESXi hosts. Run these commands on each of your ESXi hosts individually so you can see the visual differences between the outputs on each. Some commands will be used to specifically verify data plane functionality and others will used to verify communication between the data plane and control/management planes.
- First lets make sure the VIB packages were installed; specifically the ‘esx-vsip’ and ‘esx-vxlan’ VIBs. (Command used to verify data plane functionality)
esxcli software vib list | grep vsip
esxcli software vib list | grep vxlan

NOTE: This step can also be accomplished by executing the command ‘esxcli software vib list | grep esx’ instead. - The next command ensures the modules are loaded on the ESXi host. These modules provide VXLAN, firewall, DLR and bridging functionality. (Command used to verify data plane functionality)
vmkload_mod -l | grep vd
vmkload_mod -l | grep vsip

- The next command is used to ensure the ‘vsfwd’ agent is running. This service specifically connects to the NSX Manager and pulls down configuration details. This connection is then proxied to the ‘netcpa UWA’ (User World Agent) for the NSX Manager. (Command verifies data plane communication with the management plane)
/etc/init.d/vShield-Stateful-Firewall status

- The next command is used to verify the ESXi host communication with the NSX Manager. The output from this command should match the IP address of the NSX Manager. (Verifies data plane communication with the management plane)
esxcfg-advcfg -g /UserVars/RmqIpAddress

- Use this command to verify that the ‘vsfwd’ is communicating with the NSX Manager (which is where it gets its configuration parameters from). The ‘vsfwd’ agent should display several connections to the NSX Manager (IP address) on port 5671. The first IP address you will see is the local ESXi host address; the next IP address will be the NSX Manager IP address and port 5671. The connections should all be ‘ESTABLISHED’ and at the end you will see ‘vsfwd’ listed. (Verifies communication between the data plane and the management plane)
esxcli network ip connection list | grep 5671

- Next we are going to executing a command to ensure ‘netcpa’ agent is running. This agent is responsible for connecting the Controller Nodes (cluster) to acquire logical routing and switching information. This is proxied through the ‘vsfwd UWA’ when communicating with the NSX Manager. (Verifies communication between the data plane and control plane)
/etc/init.d/netcpad status

- The next command is used to ensure the ‘netcpa’ agent is connecting to the correct controller to acquire logical routing and switching information. There will be three (3) connections listed in the output of this command. The source being the local IP address of the ESXi host, followed by the IP address of a controller on port 1234. This connection is used by the ‘netcpa-worker’. (Verifies communication between the data plane and control plane)
esxcli network ip connection list | grep 1234

- The final command is used to display information about the controllers. This file contains the IP addresses and thumbprint provided by the NSX Manager to the ESXi host when they are prepared during the installation phase. If, for whatever reason, this file becomes corrupt or is accidentally edited or whatever the case may be…simply place the ESXi host into Maintenance Mode, delete this file and reboot. The file will be regenerated upon a successful host reboot.
less /etc/vmware/netcpa/config-by-vsm.xml

Conclusion
That is all there is to it when it comes to validating your NSX installation. Go through the process several times to familiarize yourself with it. Especially if you are new to NSX. It will become second nature at some point. The important part you want to do is know which commands are used for verifying the control plane, management plane or data plane. Aside from verifying your installation of NSX, these commands can also be used to troubleshoot issues when they arise.
Useful Links:
VMware NSX Command-line Reference
VMware NSX for vSphere Documentation
VMware NSX 6.2 Documentation Center
Troubleshooting VMware NSX

superb article! thanks for this information.
LikeLike
true effort thank you for sharing the information this is very helpful for the people new to the nsx technology.
LikeLike
Excellent document which covers the basic validation of your NSX environment
LikeLike