It has been far too long since my last blog post. I started a new role at World Wide Technology (WWT) back in February and hit the ground running working with my new colleagues and supporting my customers. As most of you know with a new job comes enablement and onboarding and many other things. Some of which takes a few months. Never did I imagine being a “COVID Baby” and making a change during the pandemic. All of this has been very time consuming and priority over blogging. But now I’m back!
There is some exciting things here at WWT including the Advanced Technology Center (ATC). One of the many reasons I chose to come here. If you have not seen it, you are missing out. Check it out! At your own pace you can demo the latest technology or work along our experts on a POC. Labs are available on-demand or schedulable depending on what you are looking for.
Enabling Tanzu on my homelab
Everything I am about to take you through is on my home lab. I recently updated it to the latest and greatest so I’m excited to jump into that. But like most of my blog articles in the past, let’s cover some basics first.
How would one describe vSphere with Tanzu? Simple, vSphere with Tanzu transforms vSphere into a native Kubernetes platform by enabling it at the cluster level. Once the cluster is enabled with Tanzu it is called the Supervisor Cluster (the SUPE) which runs on top of an SDDC layer than includes vSphere ESXi for compute, vSAN for the shared storage solution (used for vSphere Pods, Tanzu K8’s Cluster and VMs), and NSX-T data center for networking. Once the SUPE is created, you can then create namespaces which is called the Supervisor Namespace. DevOps engineers can then use vSphere Tanzu to run workloads consisting of containers which run inside vSphere Pods. They also have the option to create upstream K8’s cluster by using the Tanzu Kubernetes Grid Service.
So where is the value? By integrating and embedding Kubernetes directly in vSphere:
- Fusion created with vSphere and Kubernetes
- vSphere can be extended for all modern apps
- Reinforces collaboration between Developers and IT Operations (DevOps)
There are options available to customers which in my opinion, can create some confusion. I’ve experienced this confusion early on and I’ve seen it with my customers as well. So let’s sort out some of that terminology and the products in the Tanzu portfolio. Not a deep-dive by any means but some high level descriptive information that could help get through some of the marketing lingo and buzzword bingo out there!
- vSphere with Tanzu – The quickest and easiest option available. Once Tanzu is enabled it will look and feel like TKG (Tanzu Kubernetes Grid).
- Tanzu Kubernetes Grid (TKG) – Enterprise ready Kubernetes runtime.
- Sometimes referred to as “TKGm” or “TKG Multi-cloud” as it can be deployed across vSphere, AWS, VMC on AWS, Azure, Azure VMware Solution.
- TKG utilizes open-source CNCF technologies such as ClusterAPI which is the IaaS abstraction layer.
- Tanzu Kubernetes Grid Integrated (TKGi) – stems from VMware’s acquisition of Pivotal and the two companies created PKS (Pivotal Kubernetes Service) which then became TKGi.
- Instead of the ClusterAPI, it uses BOSH for the IaaS abstraction layer.
- VMware NSX-T dependency.
- Don’t get this confused with Tanzu Kubernetes Grid Instance which is a full deployment of TKG.
- Tanzu Mission Control – multi-cloud Kubernetes management platform that provides consistent operations and security to K8’s infrastructure across multiple teams and multiple clouds.
- Tanzu Service Mesh – Enterprise service mesh delivers advanced end-to-end connectivity, security, and insights for modern apps. Think of it as a “global fabric” for your applications.
- Tanzu Build Service – Build containers from source code for K8’s.
- Tanzu Application Service (TAS) – modern runtime environment for .NET, Java and Node apps.
- Tanzu Observability – powered by Wavefront, these products and services provide actionable insights into Tanzu components for multi-cloud; full-stack SDDC K8’s monitoring.
- Tanzu Application Catalog – container catalog
- Tanzu Data Services – cloud native data and messaging which includes RabbitMQ, GemFire, Greenplum and SQL.
That is some of the terminology and acronyms in a nutshell. One of my colleagues and DevOps mentors that I have connected with here at WWT wrote a great article in the ATC. Check out “Primer Series: Kubernetes on vSphere with Tanzu” by our DevOps Specialist Dana Callear and the breakdown he provides.
Here are a few other links for some Tanzu concepts and terminology. There is a lot of other information if you browse the other areas of the documentation for the VVD.
TKG Product Documentation / Concepts and References
Architecture Overview for a vSphere with Tanzu Workload Domain
Logical Design for vSphere with Tanzu for a vSphere with Tanzu Workload Domain
Network Design for vSphere with Tanzu for a vSphere with Tanzu Workload Domain
My agenda with this blog article:
- High-level overview of Tanzu including the Tanzu Portfolio
- Take you through a step-by-step procedure from my home lab where I enable Tanzu on my nested vSphere 7.0 U3 vSAN cluster.
- Review some basic tasks post-Tanzu deployment.
- Review NSX-T environment post-Tanzu deployment.
Home lab components
Let’s review the lab environment in my home lab where I will be enabling vSphere with Tanzu. As I stated above, I recently upgraded everything to the latest and greatest for vSphere and NSX. Below is a summary of the versions and specs in my nested lab environment.
- vCenter Server 7.0.3 Build 18700403
- vSphere ESXi 7.0.3 Build 18644231
- Five (5) hosts across two clusters
- Compute cluster is running 3-node vSAN (600 GB)
- Edge cluster has 2-nodes
- Nested ESXi with 8 vCPU and 64 GB memory for each virtualized ESXi host
- NSX-T Data Center 3.1.3.1.0.18504668
- Only a single NSX-T Manager appliance is deployed for lab; medium appliance size
- Two (2) Edge Node VM’s deployed; large appliance size
Good resource for you to review before enabling Tanzu is the System Requirements for Setting Up vSphere with Tanzu with NSX-T Data Center documentation from VMware.
There are two separate vSphere Distributed Switches (vDS) in my environment. One for my compute cluster where vSAN is enabled and the other is my Edge vDS for the Edge Cluster where the two NSX-T Edge Transport Nodes are deployed. I also have multiple upstream paths from my T0 gateway to my VyOS virtual router.
Below are a few images of my vSphere 7.0 U3 + NSX-T 3.1.3.1 environment.


Enabling tanzu
Before I get started I will say I am well aware there are many great articles published out there that go over the process I am about to show you. You search anywhere online and you will be sure to find one. This just happens to be my version and I’m accomplishing this in my nested home lab running the latest and greatest versions available as of October 2021. I have run through this process a few times just to familiarize myself with everything. I have also done this in previous versions, and there are some differences in the Workload Management wizard.
The Control Plane (CP) VMs are equivalent to Kubernetes control plane nodes. The VMs are created and run on the ESXi hosts that are part of the Supervisor Cluster. During the enablement process, the EAM (ESX Agent Manager) manages the deployment of the CP VMs. The DRS enabled cluster will determine the best placement; VM anti-affinity rules are created automatically to ensure they never run on the same host.
What purpose do the Control Plane VMs provide? They serve as the management and developer interface to the Supervisor Cluster; an API endpoint, Infra. Services and Pods for the Supervisor Cluster and LCM of the CP VMs. One thing to keep note of, Control Plane anti-affinity does not appear in the vSphere DRS config settings.
In vSphere with Tanzu, ESXi functions as the ‘worker nodes’ instead of using Linux. Each host will run an instance of ‘vSpherelet’ which is a special implementation of ‘kubelet’ which runs directly on ESXi and not a separate VM. This means the ‘Spherelet’ is a ‘kubelet’ that is ported natively to ESXi. This is what enables the ESXi host to become a member of the Kubernetes cluster. The Spherelet performs some critical functions including Control Plane VM communications, manage node config, starts and monitors vSphere Pods.
Let’s get started on the step-by-step!
1. Open Workload Management from the vSphere Client and click on Get Started.

2. Next I will select my vCenter Server and NSX from the options and click Next.

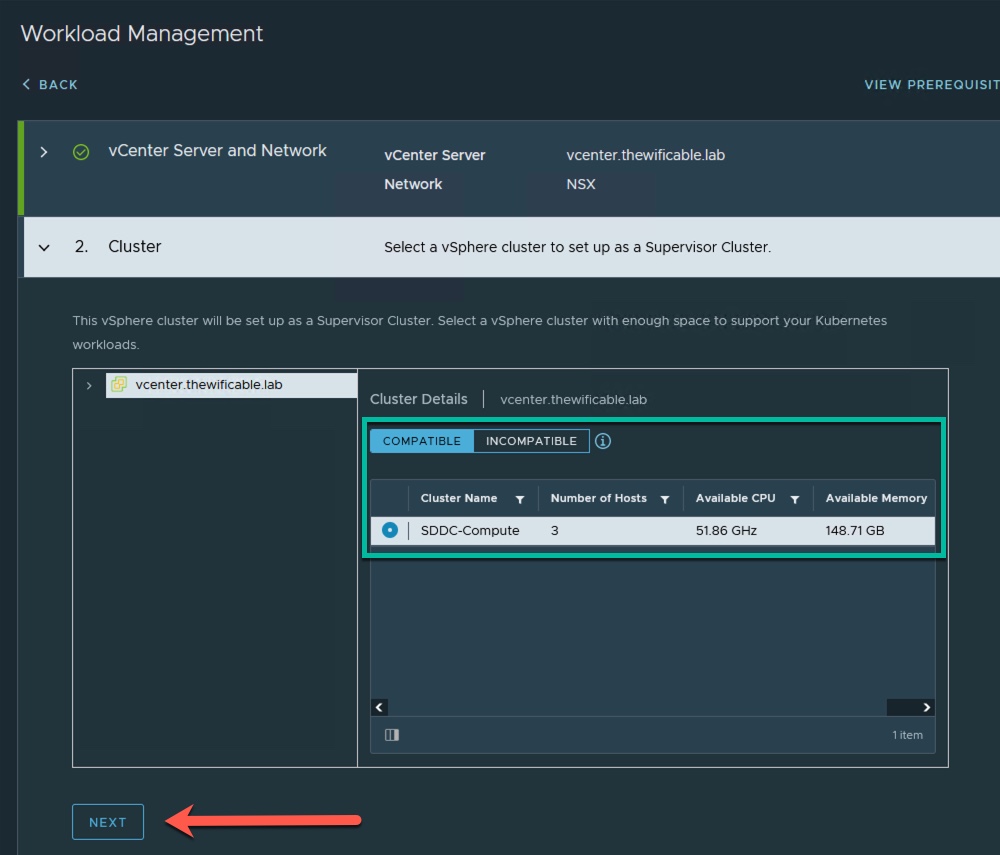
3. Select the Compatible Cluster where you plan to enable Tanzu. If you do not see your cluster here then chances are it is listed under ‘INCOMPATIBLE’ and you may need to review your cluster configuration. Could be something minor such as HA or DRS not being enabled or something else. Click Next when ready.
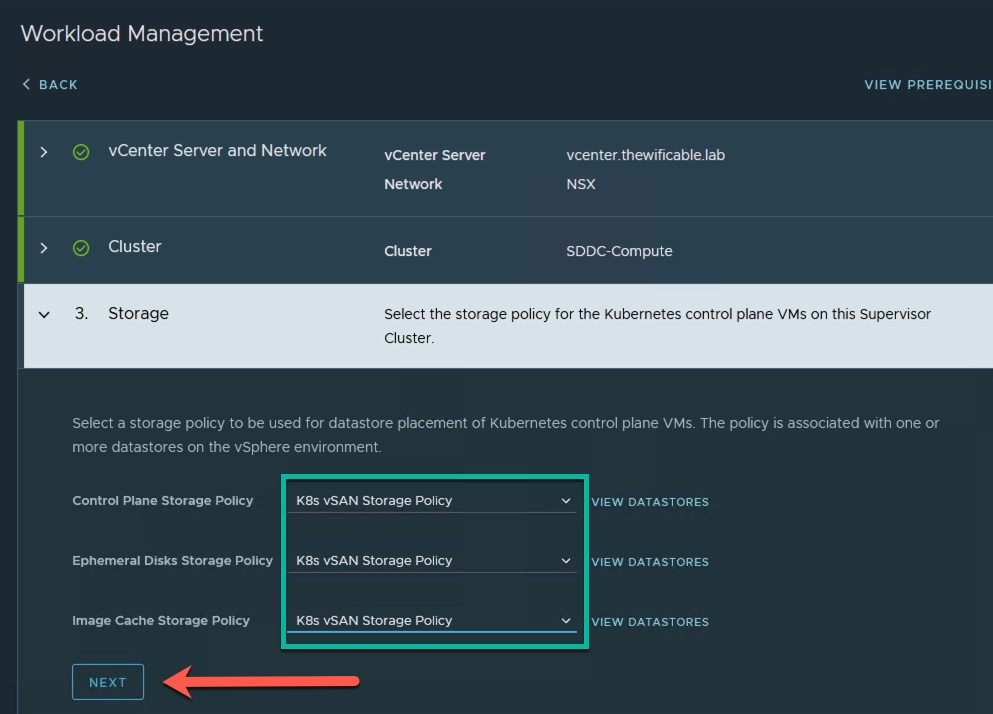
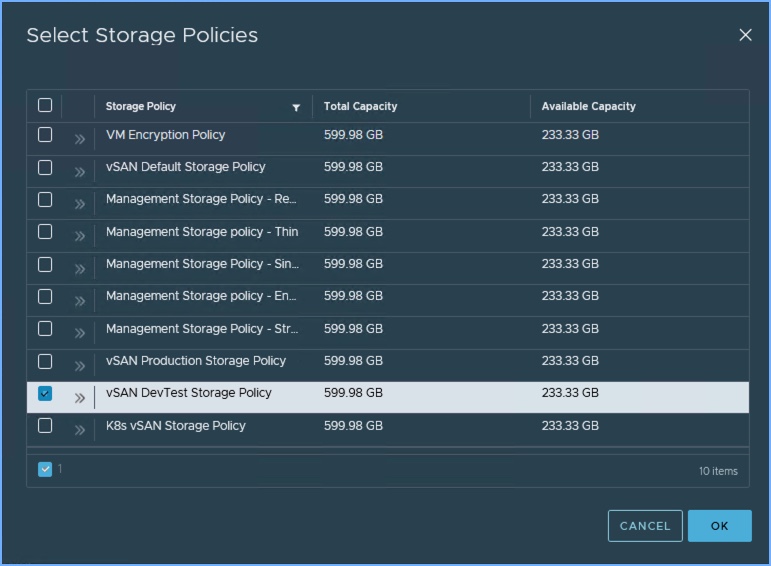
4. Select the Storage Policy for the Kubernetes control plane VMs for the Supervisor Cluster. Prior to enabling Tanzu in Workload Management I create the customized storage policy that you see below. Select your storage policy and click Next.
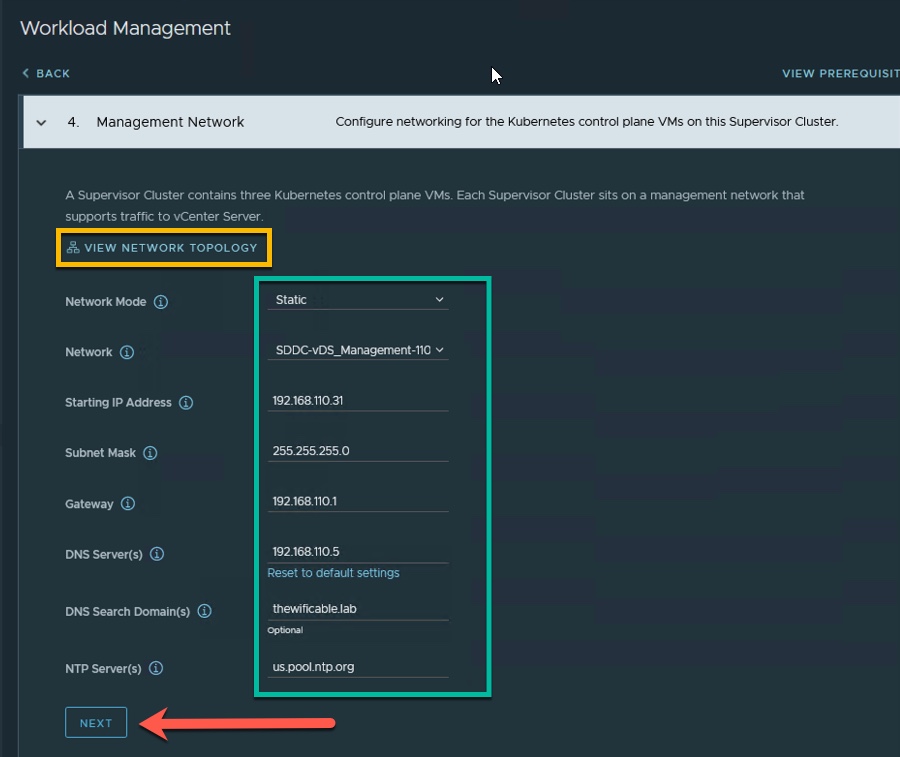
5. Next I choose the settings for the Management Network for the Control Plane VMs. The options are Static or DHCP from the Network Mode drop down menu. I have selected Static for my deployment. Then select the Management Network vDS port group and enter the static TCP/IP information for my Supervisor Cluster. Important thing to note here is make sure you have a block of five (5) IP addresses available that will increment from the Starting IP Address that you enter below. The starting IP address below ‘192.168.110.31’ also has a static DNS hostname that I created ‘tanzusup.thewificable.lab’. Click Next.
(Optional: Click on the ‘View Network Topology’ link to view a graphic illustration of how the Tanzu Supervisor Cluster will connect on the network.)

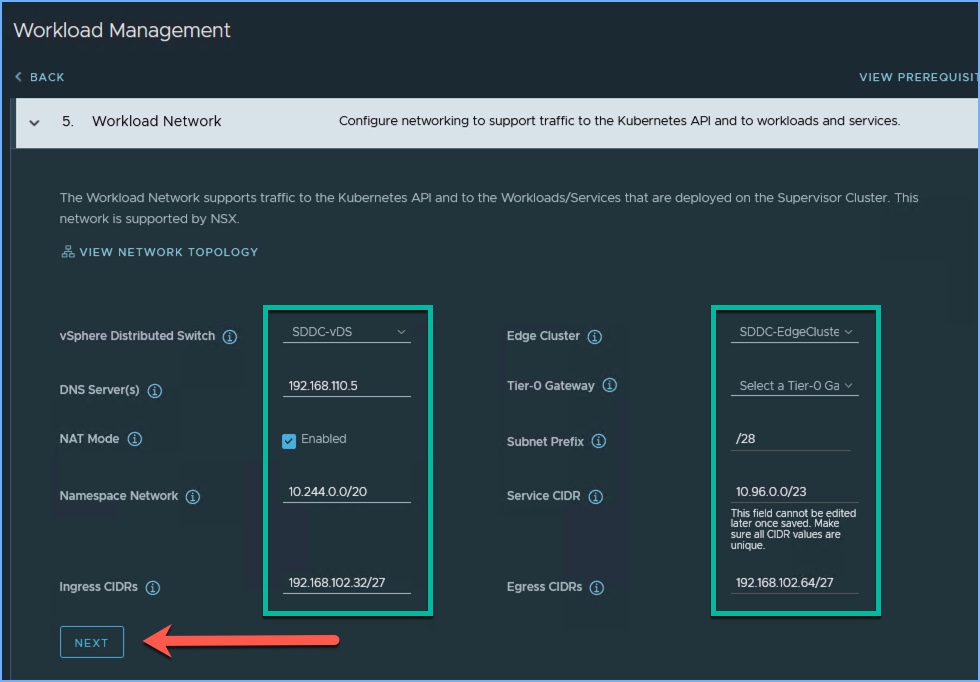
6. Next we are going to configure the Networking for the Workload Network that will support the traffic to the Kubernetes API and the workloads and services deployed in the Supervisor Cluster. This is where the NSX-T deployment comes into play for the overall configuration and deployment. Here I select the vDS associated with the cluster that I am enabling Tanzu, my Edge Cluster in my NSX-T deployment, the Tier-0 Gateway and other information. The Ingress and Egress CIDR ranges come from the external network. If you hover the cursor over the information icon next to each you will get a description of each. I created a dedicated Tanzu VLAN for my Ingress/Egress range; the 192.168.102.x network. Click Next.
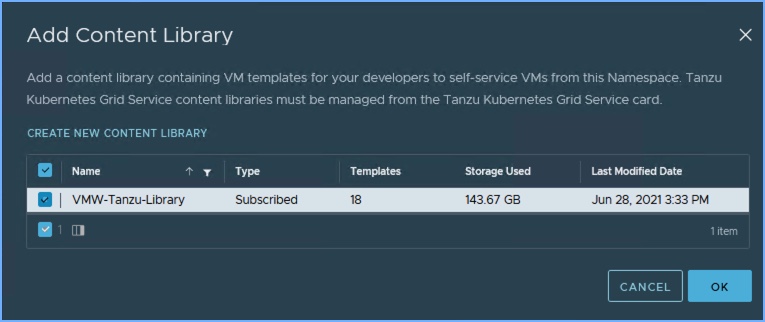
7. Next I am going to select the Content Library for my TKG Service. As the description states, the library will contain a distribution of K8’s and an accompanying OS. Click Add, select your Content Library (assuming you created one before you started) and click Next.
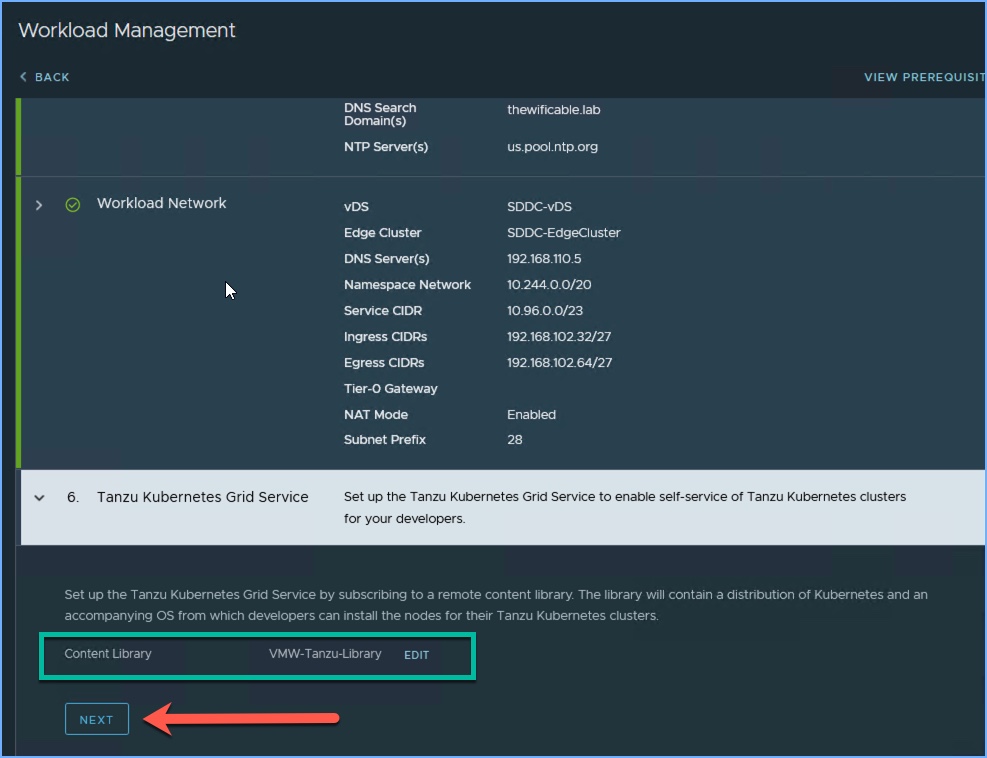
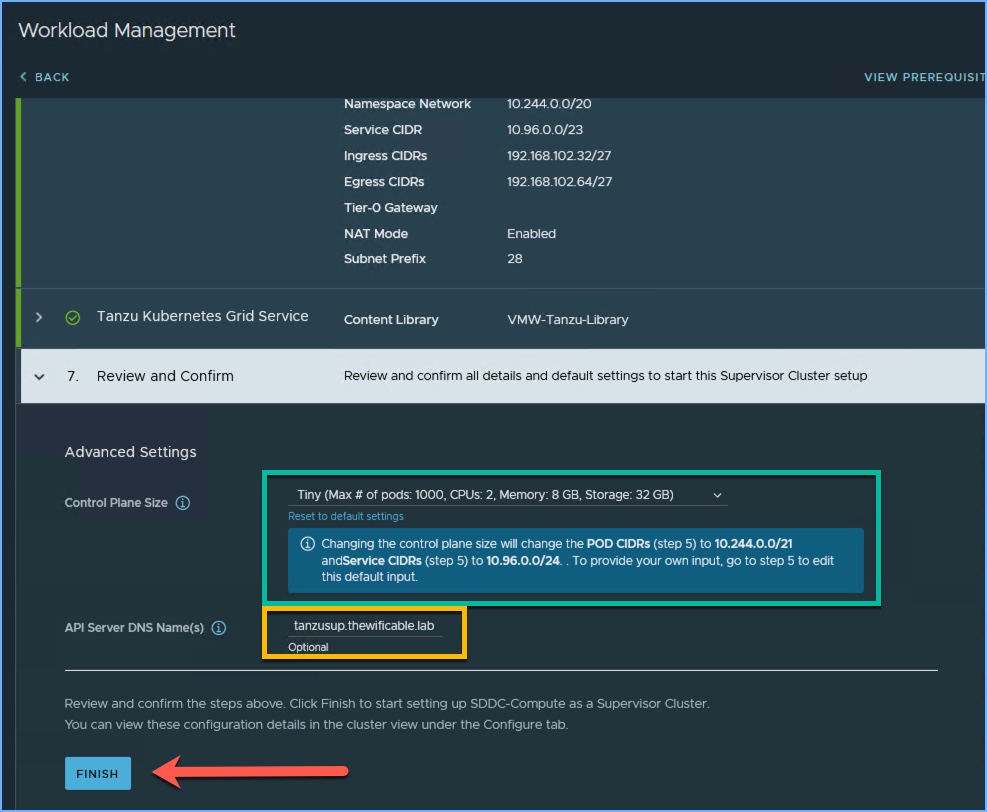
8. We are finally at the last step where we will select the Control Plane size. In previous versions of vSphere, this was typically selected earlier in the wizard but is now here at the end. I am selecting the TINY size for my lab environment. If you toggle between the different Control Plane sizes you will notice a message will appear that will state the POD CIDRs and Service CIDRs in Step 5 will be change automatically. If you wish to override this, you can go back and adjust accordingly. Notice the note for changing the default size from Small to Tiny. Remember the Starting IP address I entered back in Step 5 above? I created a static DNS hostname of ‘tanzusup.thewificable.lab’ which I can enter in the API Server DNS Name(s) option. Click Finish and the deployment will begin.
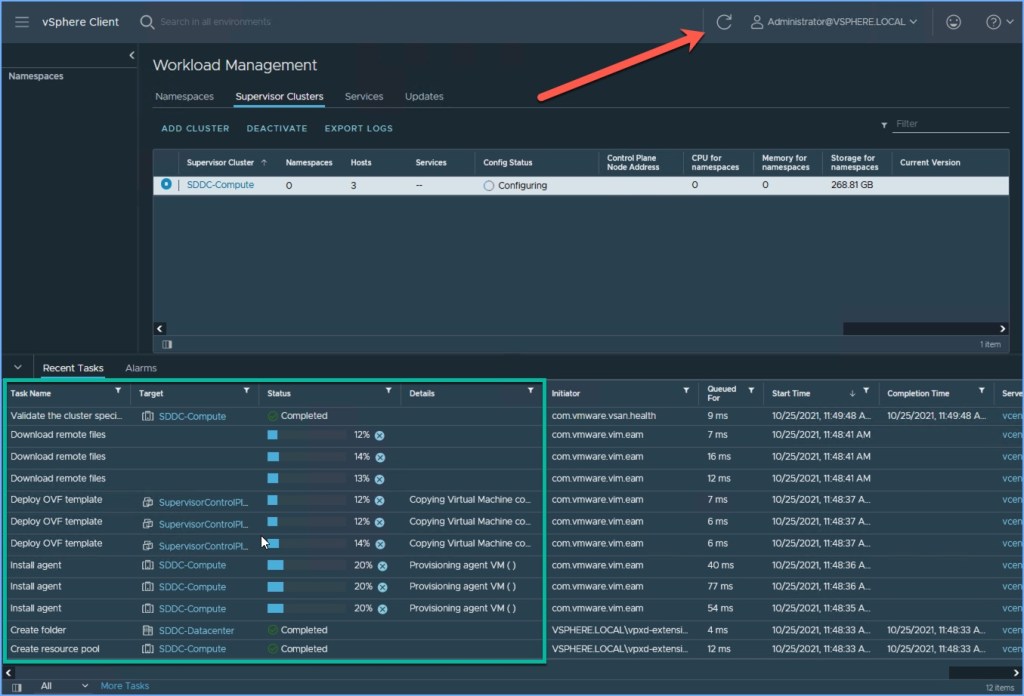
9. The Supervisor Cluster deployment will begin. Closely monitor the progress from the vSphere Client. You will see several Tasks appear below. Click Refresh above as necessary.
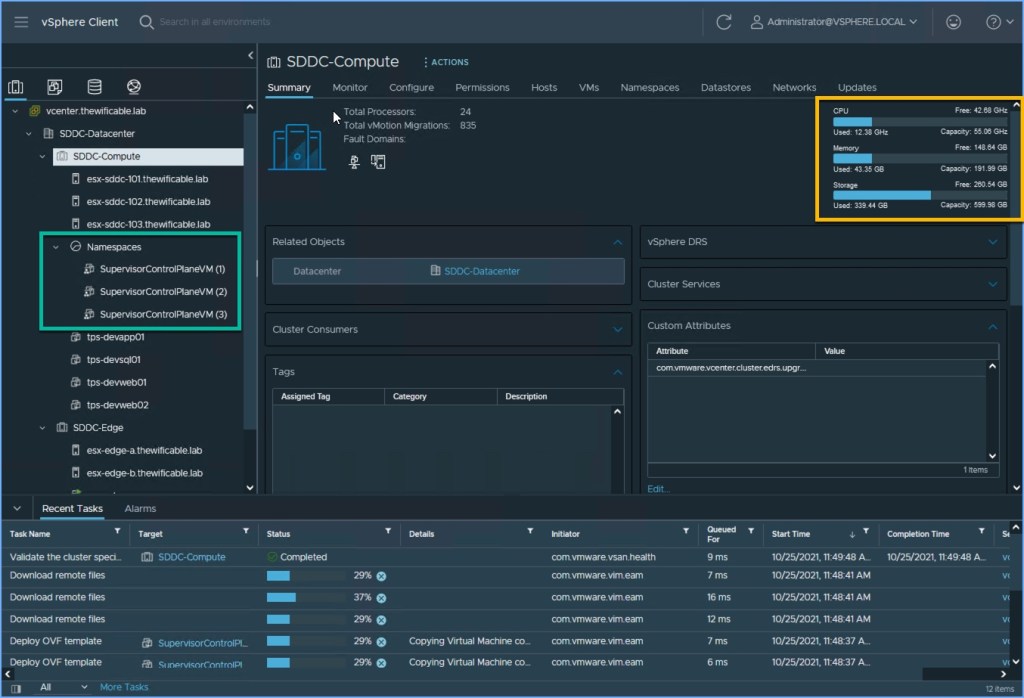
10. You can browse around the vSphere Client while the process takes place in the background. Navigate over to Hosts and Clusters and you will see ‘Namespaces’ is now available and the three (3) Supervisor Control Plan VM’s that are being deployed for Tanzu. I always closely monitor my cluster resources during deployments like this to ensure nothing abnormal takes place. Navigate back to Workload Management when ready.
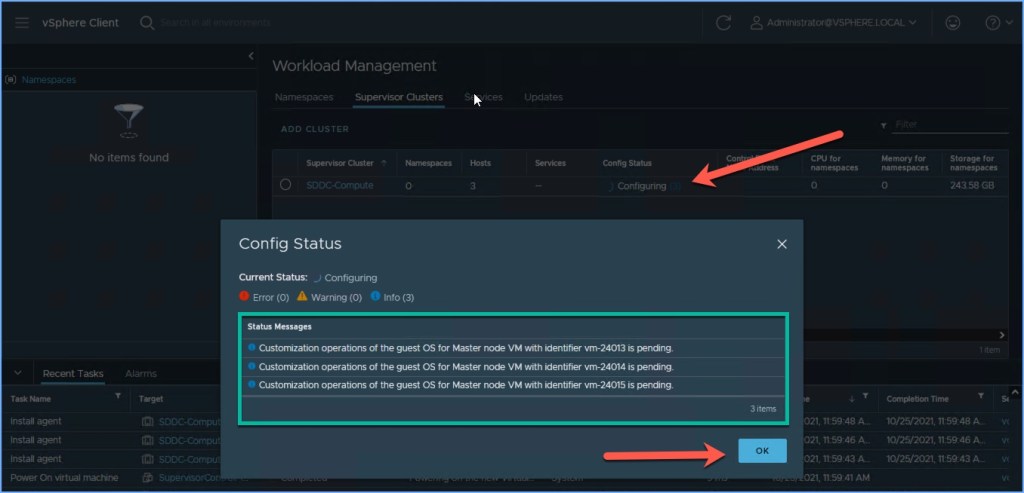
11. The process can take a bit of time so be patient and continue to monitor progress. This is when vRealize Log Insight can provide some significant value. Assuming my lab was configured for vRLI logging, I would be collecting a tremendous amount of information right now. If an error were to occur and interrupt the process vRLI would capture that information and an admin would be able to quickly use that data to resolve any issue(s) versus wasting countless man hours troubleshooting or opening a support ticket. Once the CP VMs are deployed, you will see a (3) next to Configuring in the Config Status column. Click that to view the information. Click OK.
12. After a period of time the process completes. You will likely see a message displayed in the vSphere Client that the VMware TKG plugin has been successfully deployed and you should Refresh Browser. Usually a good sign that things are progressing when you start seeing these messages appear. From Workload Management, you will see the Control Plane Node IP Address and the overall Config Status of ‘Running’ for the Tanzu Supervisor Cluster. Make note of the IP address; in this case 192.168.102.34. Also, don’t forget to license your cluster.

13. Next open a web browser to the Control Plane Node Address that was displayed above. Here you will download and install the Kubernetes CLI Tools (Kubectl + vSphere plugin) for your operating system. I have this deployed for my Windows workstation as well as a separate Admin VM (running Ubuntu). I’m not going to demonstrate how to install and configure both of these but this is where you would download the plugin (.zip file). If you scroll down further, you will see there is a download for the vSphere Docker Credential Helper as well.

create namespace
Once the tools are installed for your operating system you can now open a command line and authenticate with the Supervisor Cluster. Before we do that, let’s create a Namespace from Workload Management.
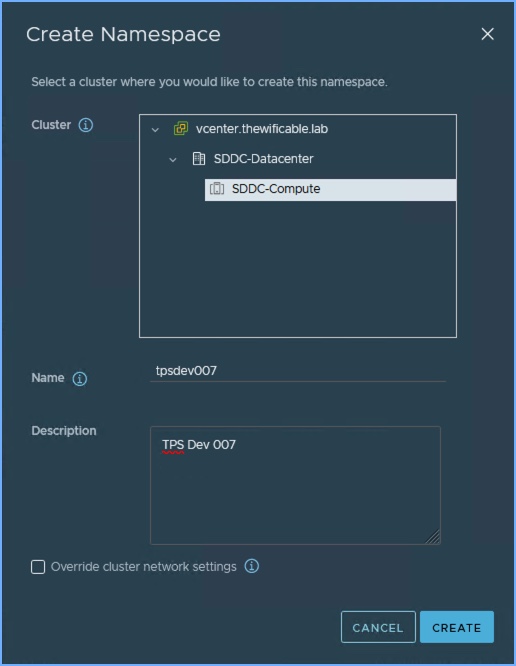
1. Click on Namespaces next to Supervisor Clusters and then click Create Namespace.

2. A new window will appear. Browse to the cluster in vSphere, enter a name for the namespace (description optional) and click Create.
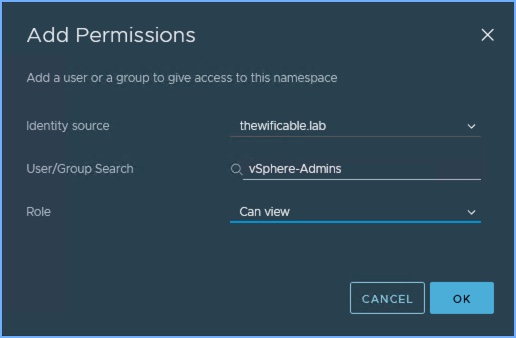
3. Now my Namespace is created! It’s that simple. Next I’m going to apply a few other settings including Permissions, Storage, VM Class and a Content Library. I’m going to skip adding limits for now but that option is available to ensure how much resources (CPU, memory, storage) can be used in this namespace.

4. I configure the Permissions, Storage, VM Service and Content Library for my namespace. The Permissions are specifically mapped to a Development Team that I created in my AD domain. The Storage settings used here are mapped to specific Storage Policy that an admin can create (i.e. Test, Dev, Production, Bronze, Silver, Gold, etc.). There are 16 default VM classes to choose from or you can create your own. Lastly, I add the Content Library.


5. I return to the Namespace Summary when I’m finished and review the settings I have selected in the previous step. Refresh window if necessary if something is not appearing.

6. Next I will verify that I can access this namespace using the kubectl CLI. Here I will log into the namespace using a DevOps user account that I created in AD and provided permissions to in the previous step. I’m including the option to skip certificate verification for now because I’m not using a trusted cert.
kubectl vsphere login --vsphere-username <username@domain> --server=https://<cluster-ip-address> --insecure-skip-tls-verify
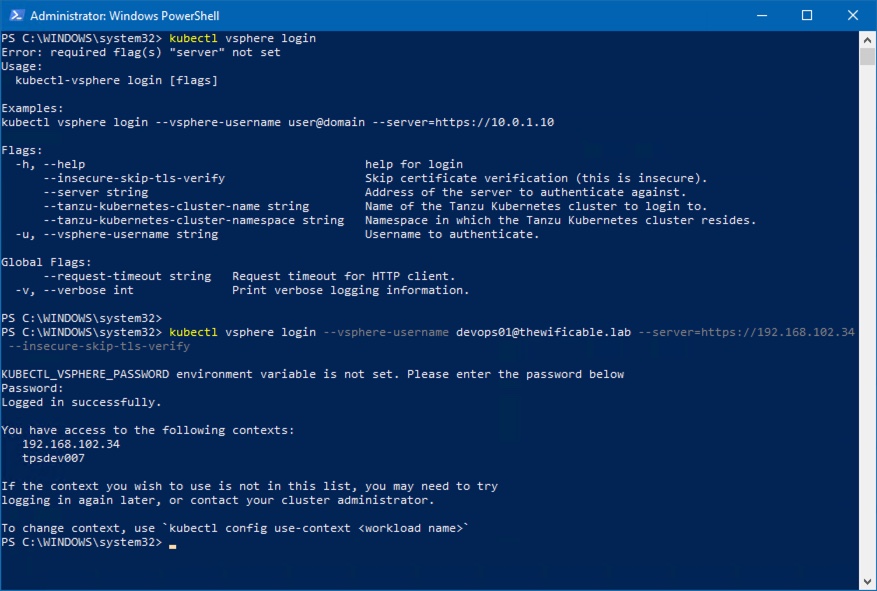
I executed the command to log into the Supervisor Cluster and you can see the Contexts that are available to the ‘devops01’ user account that I used.
7. Next I am going use the CLI to use the ‘tpsdev007’ context for the devops01 user that I am logged in with. The asterisk * in the current column indicates which context the user is currently connected to and using.
kubectl config-get contexts
kubectl config use-context <context-name>
kubectl config-get contexts

That is some of the basics for Tanzu. Enabling it on the vSphere Cluster, create a Namespace and apply some basic configuration. Browse the Workload Management portion of the vSphere Client now that it is enabled and get familiar with the management interface.
tanzu and nsx-t
Now that we have Tanzu deployed and a Namespace configured, let’s jump on over to NSX Manager and see what has happened behind the scenes automatically during the deployment. This stuff is really cool if you ask me. All of what you are about to see happened on its own using NSX and the overlay.
Tier-0 Gateways
Browse to the Tier-0 Gateways in the NSX Manager and click on the Topology Icon (C) as shown in the graphic below. You will notice two separate Tier-1 gateways connected to the upstream Tier-0 gateway.

Tier-1 Gateways
That being said, now let’s jump over to the Tier-1 Gateways and view the two gateways that were deployed automatically. The Tier-1 gateway indicated by the letter C was deployed with the Supervisor Cluster and the other Tier-1 gateway indicated by the letter D was deployed and is associated with the Namespace ‘tpsdev007’ that I created. All of this was done automatically.

NSX Segments
Next browse to the NSX Segments. I have several segments deployed previously for my traditional virtual machine workloads and at bottom you will see the two Segments that were automatically deployed. The Segment at the very bottom is associated with the Supervisor Cluster and the Segment just above that is associated with the ‘tpsdev007’ namespace. Notice the subnet ID’s to the right.

NSX NAT
Next browse over to the NAT section of NSX. First select the Gateway from the drop down menu. I’m going to focus on the two Tier-1 gateways that we just reviewed a moment ago. Select one of the two and you will see the NAT settings that were dynamically created. I selected the NAT settings for the Namespace.


NSX Load Balancing
Next I’m going to take a look at the Load Balancers that were dynamically created in NSX. You will see several below but I’m narrowing my focus on the ‘tpsdev007’ Namespace that I created earlier. Here you will see the LB that was set up automatically.

NSX IP Address Pools
IP Address Pools come in handy when you want to set aside blocks of IP addresses for services and/or applications. Aside from the TEP pool that I created, the other pools were created dynamically. The two IP pools at the top, they are the Ingress/Egress ranges that I specified during Tanzu enablement wizard. There is another pool in there for the Supervisor Cluster (block of 5) and lastly you will see a pool with the ‘tpsdev007’ namespace. Again, all done automatically.

NSX Inventory: Groups
Next let’s jump over to the Inventory section of NSX and take a look at a few things starting with Groups which come in handy when creating logical wrappers around workloads, such as containers. I quickly browsed through the groups to locate three of the four groups associated with ‘tpsdev007’ but if I were to use the SEARCH on the top right, I would be able to quickly narrow down what I am looking for here.

NSX Inventory: Containers
This will come in handy when it comes to Tanzu because heck, it shows all of your Containers and you can do so by Namespaces or Clusters (at the top). Very quick and easy method to locate the Tanzu resources and their relationships in NSX.


conclusion
That is just some basics with enabling VMware Tanzu and using NSX-T for networking. Developing an understanding of the concepts and architecture can take time. VMware offers many options based on the needs of the application as well as the teams that create and support cloud-native apps. It is best to determine those needs upfront before going with one of the various options available to customers.
I believe the value behind Tanzu is that it accelerates cloud adoption and cloud native application deployment. Vanilla K8’s is not easy to deploy and believe me, it can be very confusing. I cannot tell you how many times I have seen customers make an attempt at this with another solution only to scrap it a year later because they simply couldn’t make it work. Then operationalize it after the fact. VMware Tanzu combined with NSX eliminates a lot of complexity and manual tasks. Let the network team become the new “on-prem ISP” for the infrastructure and allow the VM admins to consume and use NSX just like you would if you were configuring an AWS VPC. Provide the core networking to the SDDC and let Tanzu and NSX do the rest.

Hi, Definitely this is good article but I have question about api server DNS name, have you created DNS record against this IP 192.168.102.34 address which is Ingress or have you created DNS record with management IP “The starting IP address below ‘192.168.110.31’ also has a static DNS hostname that I created ‘tanzusup.thewificable.lab’. Click Next.”
In my home lab I created a static DNS record for api server DNS search name with subnet of Ingress IP. I am unable to access control node VM 10.200.200.2 from browser.
Management starting IP 10.0.1.31, should I create a DNS record with this IP address”10.0.1.31″ or have to create tanzusup.tanzu.lab DNS record with 10.200.200.2
When access this 10.0.1.31 from browser its working but not with 10.200.200.2
LikeLike