Many of you have either heard of or actually used the Ruby vSphere Console (RVC) for administering VSAN. The commands ‘esxcli’ and ‘vdq’ are very useful for managing or troubleshooting VSAN directly on an ESXi host. RVC is accessed on the vCenter Server. If you are using the VCSA (appliance-based) version of vCenter you simply access it via SSH and enter:
rvc <user-acct>@<vcenter-ip>
If your vCenter Server is running on a Windows Server then RVC is located in the ‘C:\Program Files\VMware\Infrastructure\VirtualCenter Server\support\rvc’ folder and accessed through the command-prompt or PowerShell. There is also an ‘rvc.bat’ file located in this directory which you can edit to include your vCenter credentials. Then all you need to do is simply execute the batch file, enter your password and away you go.
I’m going to demonstrate some RVC commands using my vCenter Server Appliance (VCSA). First thing I did is open a Putty (SSH) console to my VCSA appliance and login with my root credentials. My VCSA is not part of a MS Active Directory domain so I am going to use the ‘Administrator@vsphere.local’ account. I used the following command to access the RVC console on my VCSA. You will then be prompted for the password.
NOTE: You do not have to Launch BASH to use the RVC. After you have connected to the VCSA using the ‘root’ account you then enter the following command.
Command> rvc Administrator@vsphere.local@localhost

I will now be at the root of the virtual filesystem. I have two options from here as seen above:
0 /
1 localhost/
To access and navigate you simply type ‘cd 0’ to access the root (/) directory or ‘cd 1’ to access the ‘localhost/’ directory. At any time I can type the ‘ls’ command to list the contents of that directory. I am going to access ‘1 localhost/’ and then examine the contents of that directory. I will have only one object inside ‘localhost’ being the virtual data center, the same exact one I see in my vSphere Web Client.

I will then proceed by typing ‘cd 0’ and then ‘ls’ to view the contents of my ‘Initech-Datacenter’ which will then provide me with 5 more options as seen below.

So there are some navigation basics. Simple CD and LS commands and if you want to collapse and return to the previous directory type ‘cd ..’ and press ENTER.
Another thing you can do is hit the TAB key twice to view a list of namespaces or sub-commands.
Using HELP
Anytime you want to learn about a particular command simply add the ‘-help’ parameter to the end of the command OR you can type ‘help’ followed by what is called the command namespace. For example….
help vsan
help cluster
help host
help vm
Return to the root of the RVC console and type ‘help’ and press ENTER. You will see a list of namespaces that RVC can manage on the vCenter Server. We are going to focus particularly on VSAN in this tutorial. Familiarize yourself a little bit sometime by using the HELP Command followed by one of the namespaces you see below.

RVC VSAN Commands
Now we are going to use RVC to perform a few tasks on an All-Flash VSAN 6.5 cluster that I recently deployed in a previous blog post.
The first command we are going to type is ‘help vsan’ and press ENTER. You will see a very long list of information including a handful of ‘Namespaces’ and then a very long list of available ‘Commands’.
Another RVC command that will come in handy with managing VSAN will be the ‘spbm’ command (SPBM stands for Storage Policy Based Management). SPBM is used to create storage profiles for VSAN. The ‘help spbm’ command will not produce nearly as much output as the ‘help vsan’ command.
Type these two commands and get familiar with some of the namespaces and sub-commands associated with managing VSAN. Play around with navigating through the namespaces and familiarize yourself with the simple basics.
> help vsan
> help spbm
We are going to focus primarily on VSAN. I will create another RVC blog article in the future for VSAN storage policy management (SPBM).
VSAN State
First lets take a look at the state of the VSAN. This command will look at the state of the VMs and VSAN objects. I can execute this command from just about anywhere BUT…I need to include the path to either a ‘cluster or host’ for this command to work properly. Here’s the command we want to execute:
vsan.check_state
We can execute this command by quickly navigating the RVC console to our vSphere Cluster (as seen in the next screenshot). Once you are there you can then enter the command ‘vsan.check_state’ and press ENTER.
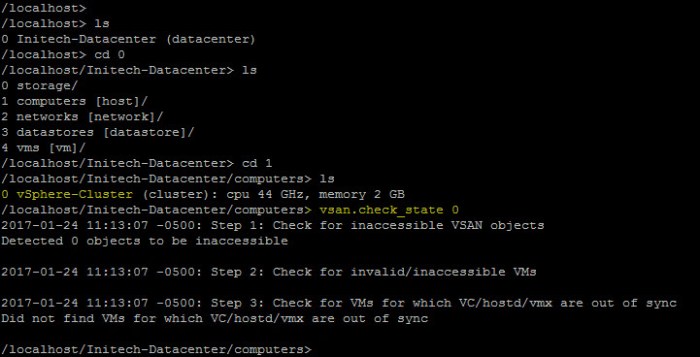
You don’t want to enter the command ‘vsan.check_state vSphere-Cluster’ as that will not work. The number ‘0’ is what you need to use to look at the state of the cluster. In this case, the proper command is:
/localhost/Initech-Datacenter/computers> vsan.check_state 0
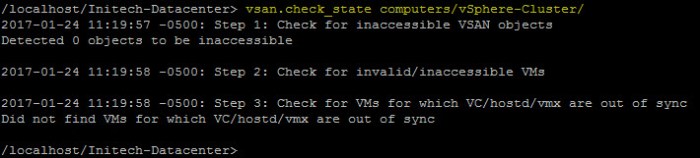
The command will execute a quick check of the VMs and the VSAN objects to ensure they are all in sync. I executed this command from the ‘/localhost/Initech-Datacenter/computers> directory. I can also execute this from the previous directory (one level down) by using the following command.
Remember…make sure you use YOUR cluster name and not the name of my cluster in the screenshot.
/localhost/Initech-Datacenter> vsan.check_state computers/vSphere-Cluster/
You don’t have to memorize your paths up and down to do this. Get use to hitting the TAB key twice to provide you a list of options. For example, if I enter the command ‘vsan.check_state’ and hit TAB twice…watch what happens. You will be provided with a list of options.
If you type ‘vsan.check_state co’ and then hit TAB twice you quickly see your command automatically complete. So keyboard shortcuts can quickly help you accomplish things if you get lost.
VSAN Object Status Report
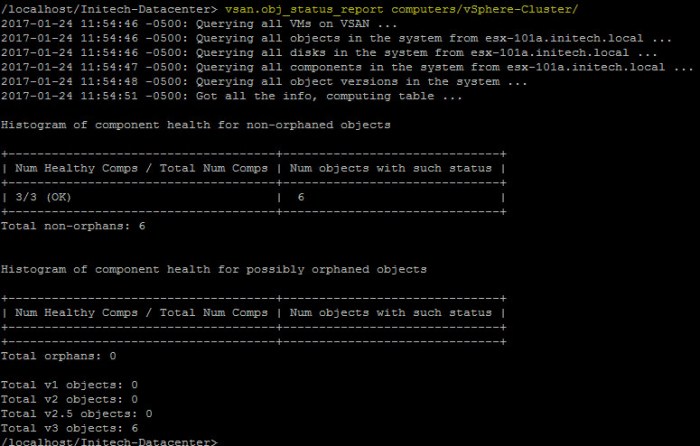
I love this command. Very useful for getting a more in-depth look at the VSAN objects and their status. This command can be executed against the cluster or a specific ESXi host. I’m going run it at the cluster level so I can get a good look at everything.
/localhost/Initech-Datacenter> vsan.obj_status_report computers/vSphere-Cluster/
I can also execute this same command and display a TABLE to display more details about the objects.
/localhost/Initech-Datacenter> vsan.obj_status_report computers/vSphere-Cluster/ -t
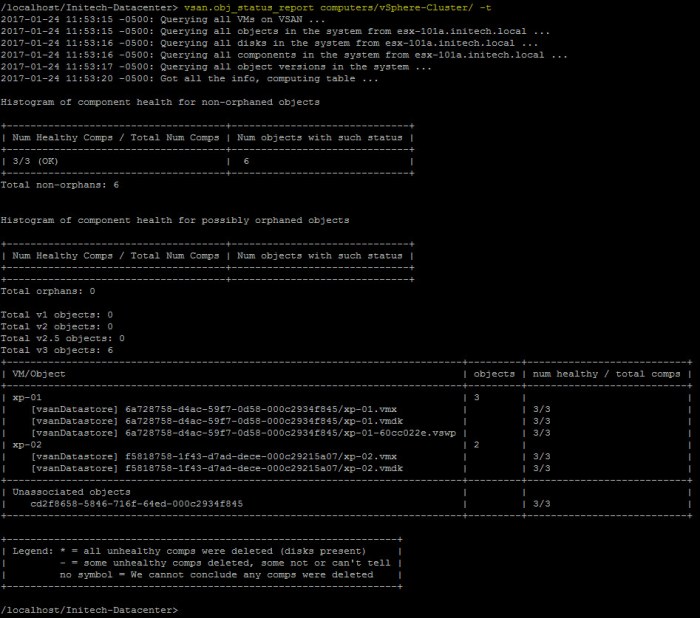
As you can see I can view more information about my virtual machines in my VSAN datastore. You will see your VMs along with some of the files associated with each VM (vmx, vmdk and vswp files). Each of these file types is an OBJECT on the VSAN datastore. Good thing here is I do not have any orphaned VMs (Total orphans: 0).
VSAN Cluster Info
Now let’s collect more info from a cluster-centric point of view. Probably the number one command in my opinion when gathering information about your VSAN. If you want a “big picture” of the cluster this is your go-to command.
First thing we want to do is navigate to the cluster object. Then execute the command:
/localhost/Initech-Datacenter/computers> vsan.cluster_info 0
The command output will produce information about each one of your ESXi hosts in your VSAN cluster. There will be a lot of information. My screenshot below only contains one of my ESXi hosts in my VSAN cluster. If I did a full screenshot of the command output you would barely be able to read any of the information.
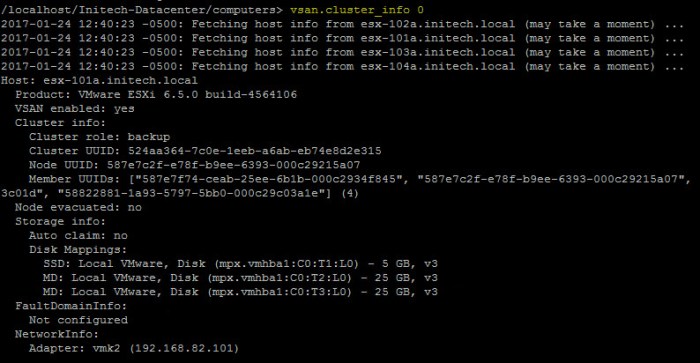
Everything about your VSAN hosts will be displayed here including ESXi host build #, Cluster UUID, Node UUID and Member UUIDs, storage info, fault domain info and lastly information about VMkernel being used for VSAN.
You can acquire the same information using the ‘vsan.host_info’ command for a particular ESXi host. I’m going to navigate a little further down the chain here before executing my command though.
/localhost/Initech-Datacenter/computers/vSphere-Cluster/hosts> vsan.host_info 0

As you can see the same information about my host is provided. So essentially the ‘vsan.cluster_info’ command is running ‘vsan.host_info’ against all of my VSAN enabled hosts and producing the output all at once.
VSAN Disk Stats
The ‘vsan.disk_stats’ command is one of the most useful RVC commands that you can use when troubleshooting VSAN. This command displays information to help you validate a BALANCED CLUSTER. Probably one of the most important qualities you want when it comes to VSAN….BALANCE!
Avoiding an unbalanced cluster is fairly simple. First and foremost make sure you are using IDENTICALLY CONFIGURED hosts when designing the VSAN cluster. I cannot stress this enough. If you were to build a cluster with different ESXi hosts with different hardware specifications you will likely experience performance issues…continuously! So don’t do it. That’s not just with VSAN. I wouldn’t do that with any vSphere cluster. You’re asking for trouble.
Now we will examine some of the disks. Execute the following command to view the VSAN disk stats.
/localhost/Initech-Datacenter/computers> vsan.disks_stats 0

I apologize for the screenshot not be very readable or view-able. But if you are executing this command in your own VSAN lab or production environment you will clearly see the disk information. There is a lot of information here.
NOTE: The output also displays SSD and MD (magnetic disk) even though I am using an All-flash VSAN. The MD is simply the Capacity Drives for my All-Flash VSAN.
Simulating Host Failure
Another one of my favorite commands in RVC is one that can help you better understand the IMPACT on your VSAN should an ESXi host (node) fail. I love being proactive and understanding impacts before something happens. Simply put….what is the affect on the storage if a single host failed? What happens to my VMs? By default this command assumes one (1) host failure. You can simulate additional host failures by using the ‘–num-host-failures-to-simulate=<i>’ or ‘-n’ parameter.
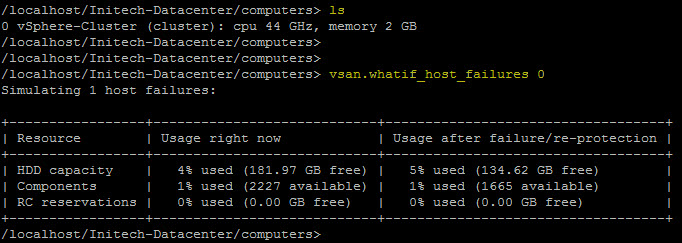
Execute the following command to view the impact of one host failure:
/localhost/Initech-Datacenter/computers> vsan.whatif_host_failures 0
You can also execute this command and simultaneously view the ‘current usage per host’ in the output. To do so, execute the following command:
/localhost/Initech-Datacener/computers> vsan.whatif_host_failures -s 0
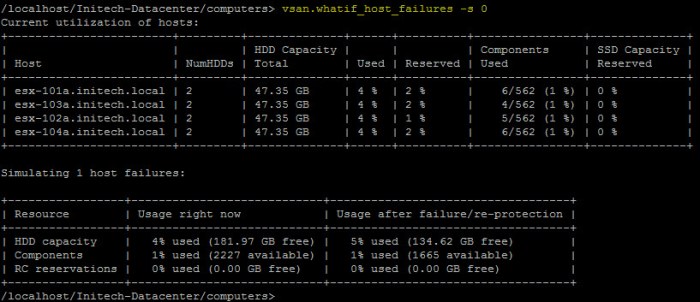
NOTE: The output will display the number of HDDs on each ESXi host even though I am using an All-Flash VSAN. These disks are simply the Capacity Tier disks for my VSAN.
VM Performance
Now lets use RVC to provide us with some disk performance stats for our VMs. This specific command is executed on a per-VM basis and not against the entire cluster or VSAN datastore. Use this if you want to investigate performance issues for a particular VM. This command will sample disk performance over a period of 20 seconds. This command will provide you with ‘read/write’ information IOPS, throughput and latency. I have a simple VM named ‘xp-01’ that I want to examine. So I executed the following command:
/localhost/Initech-Datacenter/vms> vsan.vm_perf_stats xp-01

That’s it for now. Subscribe to my blog or follow me on Twitter for some future posts on VSAN and RVC!
Useful Links
Ruby vSphere Console Command Reference for VSAN (PDF)
