Here it is as promised from the conclusion of my NSX Logical Switch Packet Walk blog article. In Part 2 of what I am calling my “NSX Packet Walk Series” we will be reviewing the step-by-step procedure of capturing packets through a Distributed Logical Router (DLR). We will initiate a continuous PING between a few virtual machines and then examine what those packets look like as they traverse the DLR. We will initiate the following packet captures:
- Capture packets (Rx) on a specific virtual switch port on our vDS that is connected to a source VM.
- Capture ingress packets of a source DLR.
- Capture egress packets of a source DLR.
- Capture packets as they leave the source ESXi host.
- Capture packets as the arrive at the destination ESXi host.
- Capture packets (Tx) on a specific virtual switch port as they head towards a destination VM.
- Capture and interpret DLR ARP resolution.
So we have a lot to cover here but first a little logical routing review. How many of you out there can actually describe the difference between a DLR and an ESG (Edge Services Gateway)? How are they similar?
The DLR and ESG are the two routing subsystems provided by NSX. Routing within the logical space (East – West Routing) is managed by the DLR. Routing between the NSX logical space and the physical world (North – South Routing) is managed by the ESG.
The DLR is optimized for operation in the “logical space” of NSX; this applies to all VM communication on VXLAN or VLAN backed portgroups. Other characteristics of the DLR include:
- High performance due to low overhead first hop routing.
- Up to 1K Logical Interfaces (LIFs) on each DLR.
- 8-Way ECMP support on the uplink interface.
- Scales LINEARLY with the number of ESXi hosts.
There are some DLR limitations that you need to be aware of including….
- You can only use one routing protocol on each DLR (OSPF or BGP…not both).
- If OSPF is used it cannot run on more than one (1) DLR uplink interface.
- A DLR cannot connect more than one (1) DLR to any given VXLAN or VLAN.
- When routing between VXLAN and VLAN the Transport Zone must be a single vDS.
The DLR functions somewhat similar to a modular router where the ESXi hosts are basically serving as linecards; all forwarding decisions are made here. The DLR Control VM (typically deployed in your Edge Cluster) is nothing more than a “Route Processor Engine” that runs dynamic routing protocols (OSPF or BGP) which exchange route info with the rest of the network. It calculates forwarding tables for ESXi hosts (linecards) based on the configuration of the LIFs, static routes and routing protocol info. The physical network connecting the ESXi hosts is nothing more than the “backplane” where VXLAN (or VLAN) encapsulated frames are transmitted between the ESXi hosts (linecards). Going forward from here on out in this blog, if I use the term “linecard” I am referring to the ESXi host.
Last but not least, always read the RELEASE NOTES for the version of NSX that you using or deploying in your environment.
Gather Information
We need to gather some information about the environment before we begin. This procedure is the same as we did in the previous packet walk walk-through. Repeat the steps in the “Gather Information” section of that article. We are also using the same NSX environment as before. A logical diagram of the infrastructure is below.
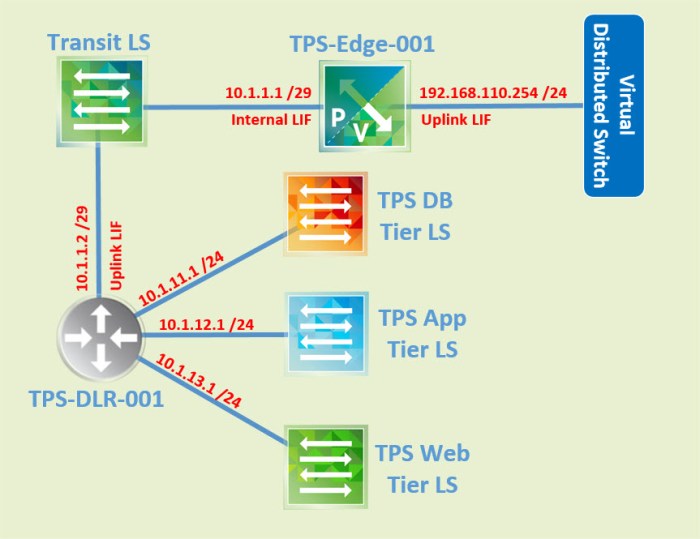
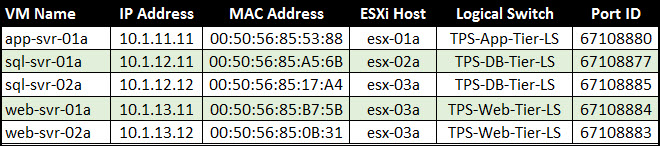
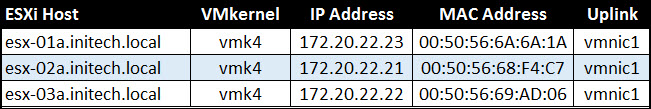
Here is a summary of the information I gathered from my VMs and ESXi hosts and recorded in the tables on my spreadsheet.
In addition to the information above we also need to gather some information about the DLR; specifically we need to find the vMAC and pMAC of the DLR based on the ESXi hosts where the VMs (listed above) are running. So I am going to open a Putty (SSH) session with each of the hosts in my vSphere “Compute Cluster” and start collecting this information.
The command you want to type to gather vMAC and pMAC information is:
net-vdr -C -l
I provided a different procedure in the previous blog article on how to find the DLR MAC address. This time around we are using the ‘net-vdr’ command. The output from my ‘esx-01a’ host is below.
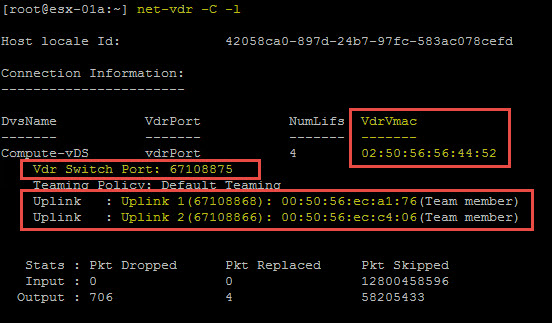
The DLR vMAC is listed in the ‘VdrVmac’ column; the pMAC is the MAC addresses associated with physical uplink(s) on the ESXi host. As you execute this command on each ESXi host you will notice that vMAC is consistent, the pMAC’s are all different. I am going to document each of my pMAC addresses for my hosts but we will likely only see the pMAC of the ‘active’ uplink during this procedure. We will also need the vDR Switch Port number.
The vMAC of my DLR is: 02:50:56:56:44:52
The vDR Switch Port # is: 67108875
The pMAC info I add to my existing ESXi host information table.
The last piece of information we need to grab is the VXLAN IDs (VNI) for each of the Logical Switches. You can find this information in Networking & Security in the vSphere Web Client or by typing the following command in the NSX Manager console (SSH):
show logical-switch list all

Summary of my Logical Switch VNI’s:
- TPS-App-Tier-LS – VNI 5001
- TPS-DB-Tier-LS – VNI 5002
- TPS-Web-Tier-LS – VNI 5003
Okay so we have all of the information we need to this point.
- IP address and MAC address for each of my VMs.
- IP address and MAC address of my VTEP VMkernel adapters.
- The vMAC and pMAC addresses for my DLR.
- The VNI for each NSX logical switch.
DLR Packet Capture
Everything is ready to go! We are going to work with two specific VMs here: web-svr-01a and app-svr-01a. The web-svr-01a VM is running on esx-03a; app-svr-01a is running on esx-01a. Here is a summary of what we will be working with during this procedure.
- web-svr-01a
- IP Address: 10.1.13.11
- MAC Address: 00:50:56:85:B7:5B
- Port-ID: 67108884
- Host: esx-03a.initech.local
- Logical Switch: TPS-Web-Tier-LS (VNI 5003)
- app-svr-01a
- IP Address: 10.1.11.11
- MAC Adderss: 00:50:56:85:53:88
- Port-ID: 67108880
- Host: esx-01a.initech.local
- Logical Switch: TPS-App-Tier-LS (VNI 5001)
- esx-03a.initech.local (VTEP VMkernel info)
- IP Address: 172.20.22.22
- MAC Address: 00:50:56:69:AD:06
- Uplink Info (Uplink 1 – Standby; Uplink 2 – Active)
- Uplink 1 (vmnic0) pMAC: 00:50:56:EE:0C:28
- Uplink 2 (vmnic1) pMAC: 00:50:56:EE:32:88
- esx-01a.initech.local (VTEP VMkernel info)
- IP Address: 172.20.22.23
- MAC Address: 00:50:56:6A:6A:1A
- Uplink Info (Uplink 1 – Standby; Uplink 2 – Active)
- Uplink 1 (vmnic0) pMAC: 00:50:56:EC:A1:76
- Uplink 2 (vmnic1) pMAC: 00:50:56:EC:C4:06
- TPS-DLR-001 (Info)
- vDR MAC: 02:50:56:56:44:52
- vDR Port #: 67108875
Before starting the packet capture we need to initiate a continuous PING from web-svr-01a to app-svr-01a.
Packet Capture Task 1
In this task we are going to capture the packets as they arrive to the switchport (Port-ID) associated with web-svr-01a. These packets are inbound (Rx) to the vDS (Compute-vDS). The web-svr-01a VM is running on esx-03a so I have to perform this capture capture on that particular host.
- Open a Putty (SSH) session with the host (esx-03a) and execute the following command to start the packet capture:
pktcap-uw -o /cap/web-svr-01a.pcap --switchport 67108884 --dir 0
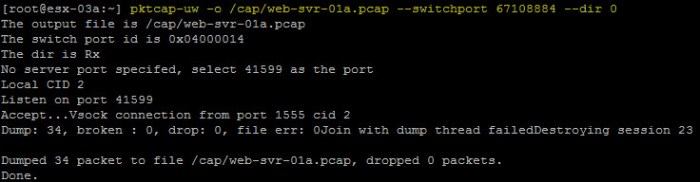
- Allow the packet capture to run for about 10 seconds (stop capture with CTRL+C) and then execute the following command to view the contents of this packet capture:
tcpdump-uw -enr /cap/web-svr-01a.pcap
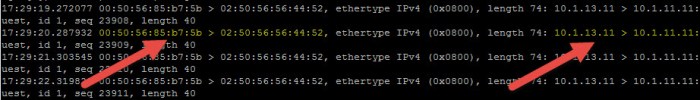
- The output of the ‘tcpdump-uw’ command is displayed. We quickly see the ‘Source MAC and Destination MAC’ at the beginning. The Source MAC is from ‘web-svr-01a’ and the Destination MAC is the vMAC of the DLR. This is expected. The Layer 3 information is the Source IP of web-svr-01a and the Destination IP is app-svr-01a.
Leave the Putty (SSH) session open with the source ESXi host and proceed to the next packet capture.
Packet Capture Task 2
Next we are going to capture and then display the packets as they enter the ‘vdrPort’ on the source ESXi host that is running web-svr-01a. The output here should be identical to what we viewed in the previous task. We will need the source VXLAN ID (VNI 5003) for this task as well as the vDR Port-ID (67108875).
- From the Putty (SSH) session with the source ESXi host, execute the following command to capture the ingress packets but this time we are using the vDR Port-ID and not the Port-ID associated with the VM.
pktcap-uw -o /cap/web-vdr-in.pcap --switchport 67108875 --dir 1 --vxlan 5003
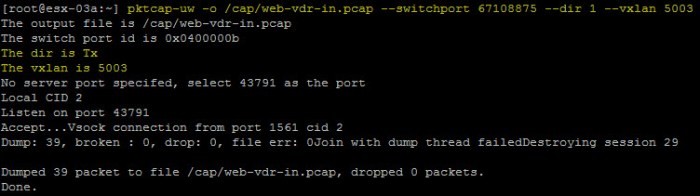
- Allow the packet capture to run for about 10 seconds (stop capture with CTRL+C) and then execute the following command to view the contents of this packet capture:
tcpdump -enr /cap/web-vdr-in.pcap
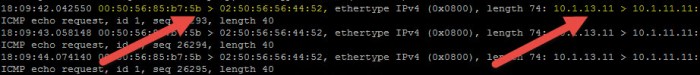
- The output of the ‘tcpdump-uw’ command is displayed. The Source and Destination MAC addresses as well as the Source and Destination IP addresses are the same as the output in Task 1. We are viewing the same packet on the vDR Port (DLR Port ID #).
Leave the Putty (SSH) session open with the source ESXi host and proceed to the next packet capture.
Packet Capture Task 3
In this task we are going to capture and display the same packet information again except this time we are going to display the packets as they leave (exit) the ‘vdrPort’ on our source ESXi host where web-svr-01a is running. We are going to use the vDR Port-ID (67108875) here again BUT we are going to use the Destination VXLAN ID for the app-svr-01a VM (VNI 5001). The output here is going to be different this time.
- From the Putty (SSH) session with the source ESXi host, execute the following command to capture the outbound packets. We are going to use the vDR Port-ID again but this time we are changing the direction and the VXLAN ID.
pktcap-uw -o /cap/web-vdr-out.pcap --switchport 67108875 --dir 0 --vxlan 5001
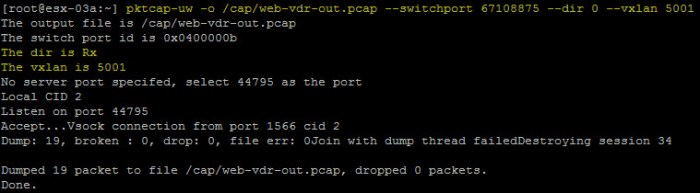
- Allow the packet capture to run for about 10 seconds (stop capture with CTRL+C) and then execute the following command to view the contents of this packet capture:
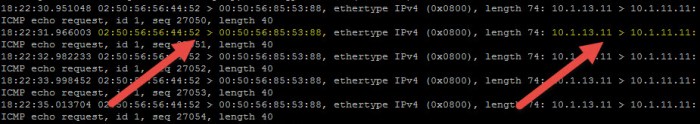
tcpdump-uw -enr /cap/web-vdr-out.pcap
- The output of the ‘tcpdump-uw’ command is displayed. This time around take a closer look at the Source MAC and Destination MAC addresses. The Source MAC address is the DLR vMAC (02:50:56:56:44:52) and the Destination MAC (00:50:56:85:53:88) belongs to app-svr-01a. The Layer 3 information remains the same.
Leave the Putty (SSH) session open with the source ESXi host and proceed to the next packet capture.
Packet Capture Task 4
In this packet capture task we are going to capture and view this traffic as it is leaving (Tx) the active physical vDS uplink (vmnic1) on the source ESXi host.
- From the Putty (SSH) session with the source ESXi host, execute the following command to capture the packets as they leave the physical vDS uplink (vmnic1) on the source ESXi host (esx-03a.initech.local).
pktcap-uw -o /cap/vmnic1-source.pcap --uplink vmnic1 --dir 1 --stage 1
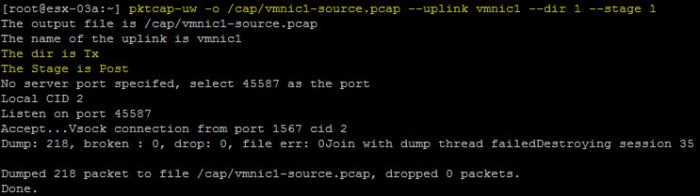
- Allow the packet capture to run for about 10 seconds (stop capture with CTRL+C) and then execute the following command to view the contents of this packet capture:
tcpdump-uw -enr /cap/vmnic1-source.pcap
- The output of the ‘tcpdump-uw’ command is displayed. Here we finally get to see the VXLAN encapsulated frame. The outer portion of the frame will include the Source and Destination VTEP MAC addresses and IP addresses (esx-03a to esx-01a). The inner portion of the frame will be identical to what we viewed in output from Task 3.

NOTE: It may take you a few moments before you locate the frame in your packet capture. A lot of information can be dumped into the capture file during this step.
Packet Capture Task 5
Now we are moving on and going to execute a few packet captures on the DESTINATION side of things. First thing I am going to do here is open a Putty (SSH) session with my destination host esx-01a.initech.local. During this task we are going to capture and view the packets as they arrive on the physical uplink (vmnic1) on esx-01a.
- From a Putty (SSH) session with the destination ESXi host (esx-01a), execute the following command to capture the VXLAN frame as it arrives on vmnic1.
pktcap-uw -o /cap/vmnic1-dest.pcap --uplink vmnic1 --dir 0 --stage 0
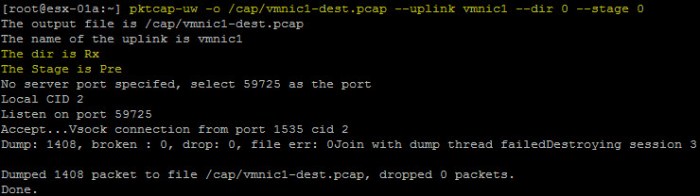
- A large amount of data will be capture here. You probably will not allow it to run for 10 seconds. Stop capture with CTRL+C and then execute the following command to view the contents of this packet capture:
tcpdump-uw -enr /cap/vmnic1-dest.pcap
- The output of the ‘tcpdump-uw’ command is displayed. The frame that we observe here is identical to what we viewed in the previous task.

Leave the Putty (SSH) session open with the destination ESXi host and proceed to the next packet capture.
Packet Capture Task 6
In this task we are going to capture and view the traffic as it leaves the app-svr-01a switch port ID (67108880).
- From the Putty (SSH) session on the destination ESXi host (esx-01a), execute the following command to capture the packets as they leave (Tx) the switchport 67108880 where app-svr-01a is connected.
pktcap-uw -o /cap/app-svr-01a.pcap --switchport 67108880 --dir 1
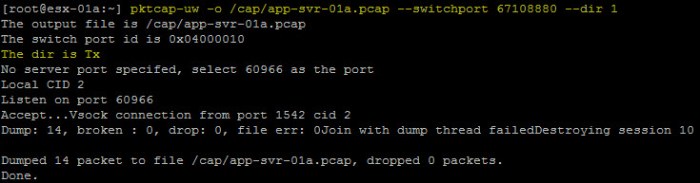
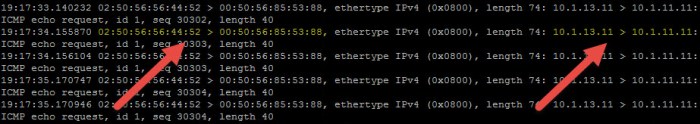
- Allow the packet capture to run for about 10 seconds (stop capture with CTRL+C) and then execute the following command to view the contents of this packet capture:
tcpdump-uw -enr /cap/app-svr-01a.pcap
- The output of the ‘tcpdump-uw’ command is displayed. Here we can see the Source MAC belongs to the DLR vMAC and the Destination MAC is that of app-svr-01a. The Source IP and Destination IP is from web-svr-01a to app-svr-01a as we would expect.
Leave the Putty (SSH) session open with the destination ESXi host and proceed to the next packet capture.
Packet Capture Task 7
In this final task we are going to capture and interpret DLR ARP resolution. We will see the ARP request that originates from the vdrPort (67108875). We are going to execute these commands from the source ESXi host (esx-03a) where web-svr-01a is running. The only difference here is we want to initiate a PING to a different destination VM. The reason for doing so is because the ARP requests from web-svr-01a to app-svr-01a (in our previous tasks) already have an entry in the ARP cache. So in this case we are going to initiate a continuous PING from web-svr-01a to sql-svr-01a. We’ll use our output to determine the destination VM’s MAC address.
- Return to the Putty (SSH) session on the source ESXi host. Our first command here is going to be used to capture the ARP traffic as it exits the vdrPort. We will also use a ‘Session Filter’ here to capture that specific ARP traffic.
pktcap-uw -o /cap/dlr-arp.pcap --switchport 67108875 --dir 0 --ethtype 0x0806
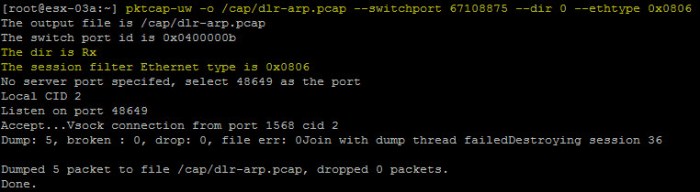
- Allow the packet capture to run for about 10 seconds (stop capture with CTRL+C) and then execute the following command to view the contents of this packet capture:
tcpdump-uw -enr /cap/dlr-arp.pcap
- The output of the ‘tcpdump-uw’ command is displayed. Here we can see web-svr-01a sending an ARP request for sql-svr-01a (10.1.12.11). The Source MAC is the vMAC of the DLR and the Destination MAC is a ARP broadcast asking as seen ‘who-has 10.1.12.11 tell 10.1.12.1’. The address 10.1.12.1 is the IP address associated with a LIF on my DLR.

- Execute the following command on the source ESXi host to view the VXLAN encapsulated ARP request.
pktcap-uw -o /cap/dlr-uplink.pcap --uplink vmnic1 --dir 1 --stage 1 --ethtype 0x0806
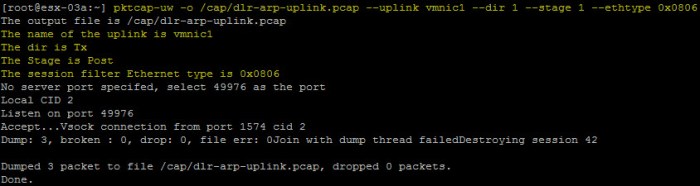
- Allow the packet capture to run until you see a few packets dumped (stop capture with CTRL+C) and then execute the following command to view the contents of this packet capture:
tcpdump-uw -enr /cap/dlr-uplink.pcap
- The output of the ‘tcpdump-uw’ command is displayed. Here we can see the encapsulated frame that was returned to the source ESXi host. I am using ‘Unicast’ replication for my Transport Zone, therefore the source host will send the VXLAN frame to each host that has joined the VNI via unicast.

Conclusion
This concludes the DLR Packet Walk. This is a very useful procedure for any NSX admin that wants to capture and view ‘East-West’ traffic as it traverses a DLR. Very useful when it comes to troubleshooting in NSX as well. As I mentioned in my previous blog, knowing how to perform this procedure manually will really help provide you with an in-depth understanding of your NSX environment. More sophisticated tools such as vRNI, vRealize Operations Manager and vRealize Log Insight will go a long way but understanding the ‘long hand’ method of performing these operations can really help you.
I have one more ‘Packet Walk’ post coming for you all. Next time we will go through a Distributed Firewall (DFW) Packet Walk. This one has to be my favorite of all these packet walk exercises as we will turn on some firewall rules during this process and view packets that are dropped due to a DFW rule.
BE SOCIALABLE & SHARE! 🙂

Can you share the capture files for public
LikeLike
Sorry. I did this lab a long time ago and did not save those capture files. If I do another write up on this one day I’ll be sure to do that. I apologize some of the screenshots are so small.
LikeLike
This is a very informative overview of DLR functionality.
LikeLike