The newly integrated Packet Capture tool in NSX 6.4 is very useful. I wrote three blog articles about year ago on how to perform packet captures from an ESXi host using the native ‘pktcap-uw’ command. Those tools still exist for you to use but this new tool is now available in the vSphere Web Client and the new vSphere Client (HTML5). I am going to demonstrate some basic packet captures for you so we can see how packets traverse my NSX network.
We are going to work with a very simple scenario where we will capture packets between two VMs connected to the same NSX logical switch. Nothing complex and no DFW rules in place to impede the ICMP communication that we will use for the demonstration.
Another thing you will need to do prior to starting your capture procedure is gather some information about these VMs and the ESXi hosts. For the VMs you should have the following information available.
- IP Address
- MAC Address
- ESXi host where the VM resides
- NSX Logical Switch
- Port ID
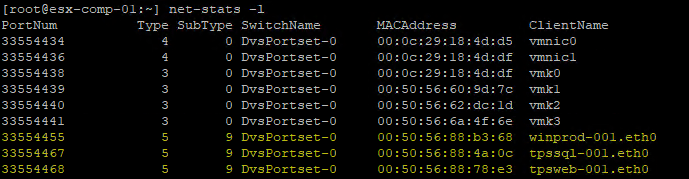
The port ID for the VMs can be obtained in one of two ways. You can run the ‘esxtop’ command and then type ‘n’ to switch to networking. The PORT-ID column will display the VM port numbers for the VMs running on that particular host. My favorite method is simply typing the following command and locate the port number in the first column. The other great thing about this command is it also display the VM MAC address which you will also need.
net-stats -l
As for the ESXi hosts you should gather the following information.
- ESXi hostname
- VTEP VMkernel (vmk#)
- VTEP IP Address
- VTEP MAC Address
- VTEP active uplink (vmnic#)
Here are my tables from my spreadsheet containing the information that I will be using for this exercise.
VM Information

Host Information

Let’s move onto the first packet capture task! The one thing you should download and install on your local system is the program Wireshark.
Packet Capture Task 1
In this first packet capture task we are going to capture a simple ICMP transmission between two VMs residing on the same NSX logical switch but reside on separate ESXi hosts. Here is a brief summary of the information I need for running a ‘PING’ between my two (2) web servers.
- tpsweb-001 (VM)IP Address: 10.10.10.11
-
- MAC Address: 00:50:56:88:78:e3
- ESXi Host: esx-comp-01
- Port ID: 33554468
- tpsweb-002 (VM)IP Address: 10.10.10.12
-
- MAC Address: 00:50:56:88:ef:61
- ESXi Host: esx-comp-02
- Port ID: 33554476
- esx-comp-01 (vmk3)IP Address: 192.168.200.101
-
- MAC Address: 00:50:56:6a:4f:6e
- Active Uplink: vmnic1
- esx-comp-02 (vmk3IP Address: 192.168.200.102
-
- MAC Address: 00:50:56:69:22:6a
- Active Uplink: vmnic1
- TPS-Web-Prod-LS (NSX Logical Switch)VNI: 5004
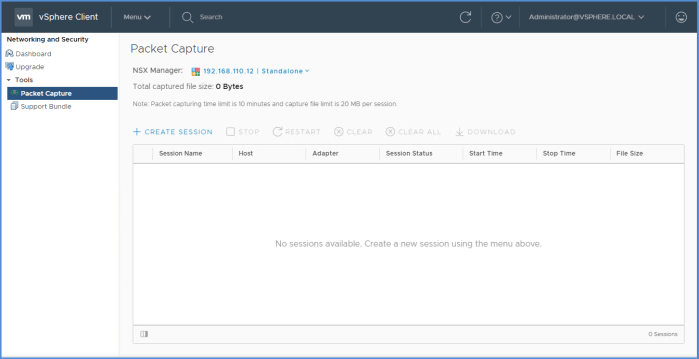
Next I am going initiate a PING from tpsweb-001 to tpsweb-002. I am also going to be doing everything from the new HTML5 client. I am just going to let ping run continuously. I then log into the HTML5 client and access the Packet Capture tool inside Networking and Security as seen below.
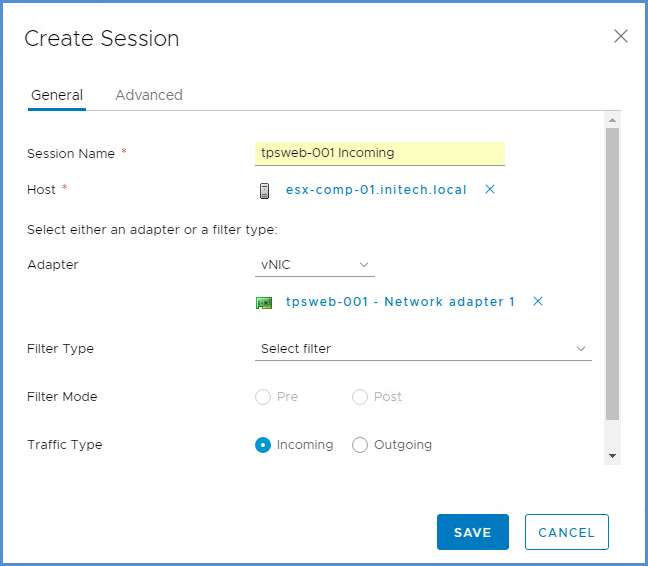
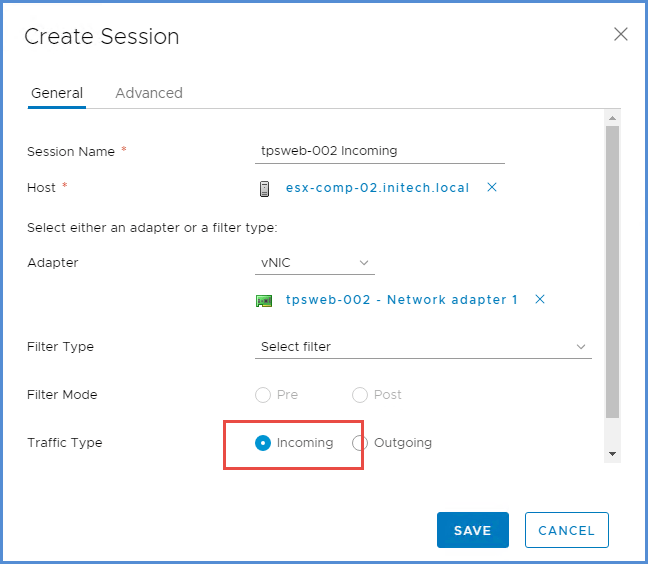
Next thing you are going to do is select CREATE SESSION and a new window will appear. I am going to provide a session name and select the esx-comp-01 host where the tpsweb-001 resides. I will then select the vNIC option for my adapter and then select the vNIC of the source VM. In this case I select the vNIC associated with my tpsweb-001 VM. I won’t be selecting a filter for now because I am not applying any filters. We will work with those later so don’t worry for now. For Traffic Type I am going to select the Incoming option.
First an important thing to help understand Traffic Type. The incoming and outgoing is in reference to the virtual switch of the host you are capturing from and not the adapter that I have chosen. So in this case I want to capture the traffic that is leaving the vNIC on my tpsweb-001 VM and as it enters the virtual switch on esx-comp-01. So I must select the INCOMING option here. Very easy to get confused and thing because we have selected the vNIC on tpsweb-001 that we need to choose OUTGOING and that is false.
Here is what my settings look like for my new packet capture setting before I click Save.
As soon as you click on SAVE the packet capture will begin. Allow the packet capture to run for a few moments 10-15 seconds at most for this exercise. Then select the STOP option above. You will then be prompted to stop the session. Click YES.

Upon stopping the capture the Session Status will state ‘Finished’ and the capture file download will now be available. Select the download link and save the file locally on your system.

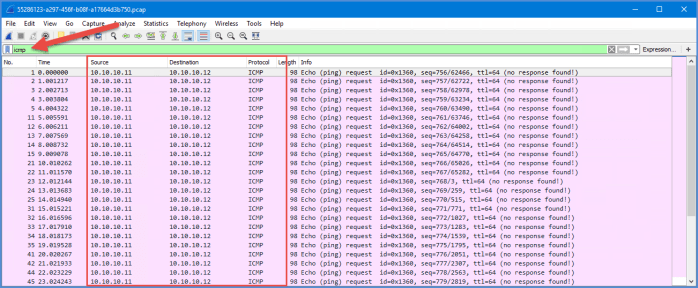
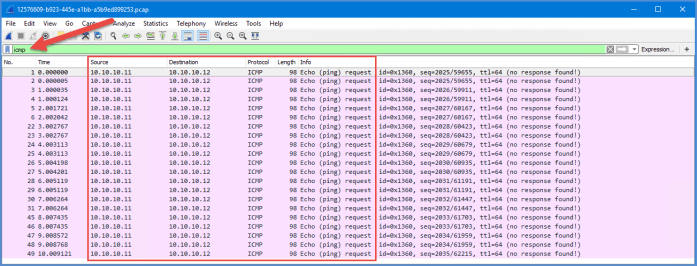
Open the file in Wireshark and type ‘icmp’ in the display filter at the top of the program. You will now see a list of the packet that originated from tpsweb-001 destined for tpsweb-002 (Source and Destination IP address columns).
Now lets create another session where we want to capture this echo request as it heads towards tpsweb-002 running on esx-comp-02. What should our settings look like on our packet capture? Remember this packet is leaving the virtual switch on esx-comp-02 and in the direction of the vNIC on my tpsweb-002 VM. So I want to capture the outgoing traffic.

Again I stop the session and download the packet capture file and open it in Wireshark. Enter ICMP into the display filter and examine the results. And there you will see the same ICMP echo request coming from tpsweb-001 (10.10.10.11) to tpsweb-002 (10.10.10.12). I basically traced the path of this ICMP packet as it left the source and arrived at destination.
Now let’s reverse and trace the ECHO REPLY that we want to see from tpsweb-002 to tpsweb-001. I start a new session with the following settings. My goal here is to find the packet that is coming from tpsweb-002’s vNIC and entering the virtual switch on esx-comp-02. Here is the session settings that I will use to locate that specific information.
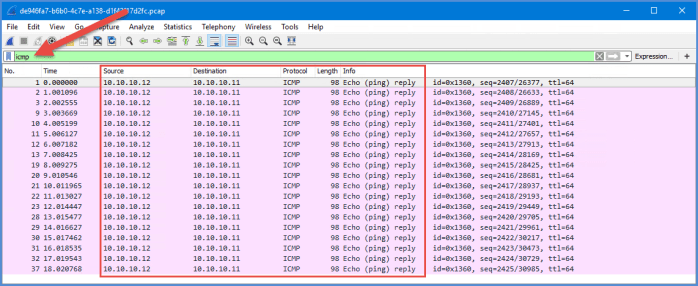
Once again, allow the session to run a few seconds, stop the session and then download the capture file and open it in Wireshark. We will now see the echo reply from tpsweb-002 (10.10.10.12) destined for tpsweb-001 (10.10.10.11).
And now the fourth and final step. Let’s trace the ICMP reply as it arrives back at tpsweb-001. I set up my capture session with the following settings.

One last time let the session run for about 10-15 seconds, stop the session and then download and open capture file in Wireshark. We will see the Echo Reply as it arrives back to tpsweb-001 (10.10.10.11) from tpsweb-002 (10.10.10.12).

So there we have it. We traced an simple ICMP request from the a source to destination; between two VMs running on the same NSX logical switch on two separate hosts.
Now the best part. Let’s take a look at the VXLAN encapsulated frame that exists during this transmission. This is the fun part that I like the most.
The traffic we are looking to capture is the VTEP communication going on between esx-comp-01 and esx-comp-02. So the traffic will be leaving esx-comp-01 headed for esx-comp-02 using the physical vmnic uplinks (vmnic1 on both hosts). Here is the packet capture session we need to run in order to see this in action.

We select the local ‘nic-0…..ESXi-Firewall.0’ filter type and use the POST filter mode. The other filters we will be associated with VMs. The PRE and POST options are simple to understand and I will break it down really easy for you.
- PRE is used to capture the traffic before it was encapsulated by VXLAN
- POST is used to capture the traffic after it is encapsulated by VXLAN.
We want to capture the VXLAN encapsulated traffic as it leaves the source host esx-comp-01; therefore we need to choose the POST and OUTGOING options in our session. Now let’s examine the VXLAN encapsulated frame that contains the ICMP echo request from tpsweb-001 (10.10.10.11) to tpsweb-002 (10.10.10.12).

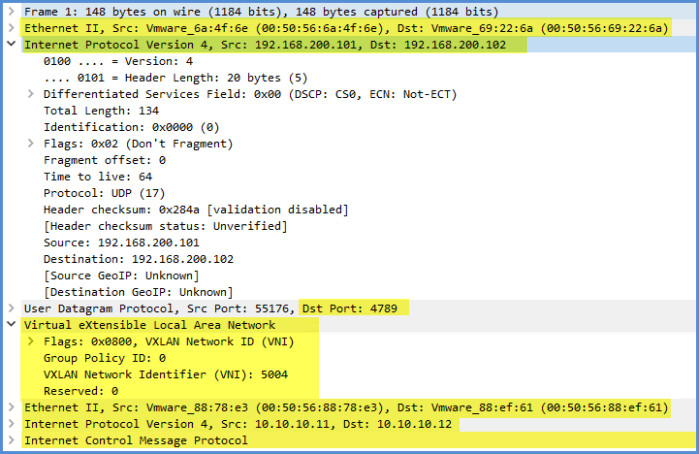
In the top section (pink area) we will literally see the same packet info that we have been seeing throughout this process. In order to see the VXLAN encapsulated frame we need to look in the middle section of the packet capture in Wireshark to unveil some really cool information. I have highlighted a few areas where we can view the following information:
- Source and Destination for the VTEPs communicating with one another; including VTEP MAC addresses and TCP/IP addresses.
- Scroll downad a little bit and we will see the VXLAN VNI header info where we also see VNI 5004 which is associated with the NSX logical switch ‘TPS-Web-Prod-LS’ where the two VMs are connected.
- You also see Port 4789 which is the VXLAN port.
Here is another screenshot of that important information that we can see in Wireshark ( I zoomed in a little for you).
If you want to capture the VXLAN frame containing the ECHO REPLY by simply running the same packet again but on the esx-comp-02 physical vmnic1 adapter. I’ll leave that task to you! 🙂
Conclusion
The new NSX 6.4 packet capture tool is a great new tool that is exclusively part of this version of NSX. Keep in mind this tool is not limited to only capturing NSX related traffic. If you wanted to troubleshoot or view the transmission between ESXi vMotion vmkernel adapters, ESXi vSAN vmkernel adapters or other traffic in your vSphere environment you can do exactly that. It is not limited to capturing NSX traffic only. You can accomplish a variety of packet captures using the tool.
Just remember two key things when executing packet captures and that is knowing which ‘Filter Mode’ and ‘Traffic Type’ you want to set in your session. PRE is traffic before it is encapsulated by VXLAN and POST is traffic after it is encapsulated. The ‘Incoming’ and ‘Outgoing’ options are from the virtual switch point of view of the host your are working from and not the virtual machine, physical adapter, vmkernel adapter and so on. Once you understand that clearly it will make things much easier for you.
Useful Links
NSX 6.4 Administration Guide (PDF) – Packet Capture Tool found on page 450.
Demo of NSX 6.4 Packet Capture tool on a vSAN vmKernel – YouTube video by Eric Sloof
And lastly from my older posts where I use the ‘pktcap-uw’ utility to accomplish similar tasks from ESXi (pre-NSX 6.4 Packet Capture Tool)
