Here in Part 3 of my “NSX Packet Walk Series” I will be reviewing the step-by-step process of capturing and analyzing packets from the Distributed Firewall (DFW) data path. This procedure is very useful during troubleshooting. We are going to accomplish the following tasks after gathering some important information about the environment.
- Capture packets when traffic is allowed.
- Create a DFW rule that BLOCKS traffic.
- Capture the packets when the traffic is prohibited by the user create DFW rule.
- Analyze the DFW logging info for ‘allowed’ and ‘blocked’ traffic.
Next a brief overview of the NSX DFW.
Overview of the NSX DFW
Here is a quick overview before getting started. The NSX Distributed Firewall (DFW) is exactly as its name implies. The firewall is distributed across the ESXi hosts and runs as a ‘kernel service’ on each ESXi host.
- vShield-Stateful-Firewall service daemon (user space)
- VSIP (kernel space)
These two services must be running on your ESXi hosts. Take a look at my NSX Validation Procedure for a step-by-step process for verifying these services on your hosts.
The rules created in the DFW can be based on Layer 2, Layer 3 and Layer 4 and can expand up to Layer 7 using 3rd party integration such as Palo Alto Networks or CheckPoint. If you plan on enhancing your security with a 3rd party solution just make sure it is compatible with the version of NSX that you plan on deploying. You do not want to encounter any surprise ‘gotchas’ during implementation.
So how does the DFW affect Layers 2 through 4?
- Layer 2 DFW rules are based on MAC addresses and other L2 protocols such as LLDP, ARP and RARP, etc.
- Layer 3 rules are based on IP-source/IP-destination.
- Layer 4 is based on a TCP or UDP port number associated with a service (or application).
TIP: Service Composer will make your life a lot easier so get creative and leverage this feature as much as possible (aka Intelligent Grouping).
If you wish to take advantage of the NSX Identity Firewall feature you must deploy NSX Guest Introspection prior to creating any DFW rules. Lastly, as the vSphere environment scales with the addition of ESXi hosts the throughput capacity of the DFW will also increase.
Gather Information
Before we begin the DFW packet walk we need to gather some information about the environment. Repeat the steps in the “Gather Information” section of my NSX Logical Switch Packet Walk and document the information into a spreadsheet. My lab environment has “evolved” a little bit since my last packet walk article. We need information about our Virtual Machines and ESXi hosts (VTEP vmkernel) but we also need some additional information from the VMs…specifically the ‘dvFilter’ for each VM. I’ll get to that process in a moment.
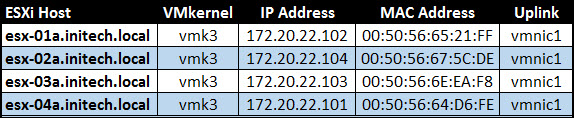
Here is the information pertaining to my ESXi hosts running the VMs that I will be capturing packets for the DFW:
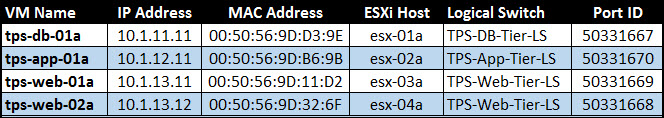
Next is the information gathered for my VMs. These VMs are all running CentOS 7 (minimal installation) with a few services installed locally including SSH on all of them.
In addition to this information I need to gather a little bit more information about my VMs and the distributed firewall. The ‘vmware-sfw’ agent is a part of ‘Slot 2’ of the VMs vNIC. This information can be acquired in one of two ways.
Summarize-DVfilter Command
Connect to each ESXi host where the VMs are running and execute the ‘summarize-dvfilter’ command to acquire the ‘stateful firewall’ name (or ID) associated with the VMs that you want to capture packets. For example, I open a Putty (SSH) session with esx-01a so I can gather information about my VM tps-db-01a.
summarize-dvfilter
The command will spit out information about every VM running on that particular host. I sort through the output and find the VM that I am going to be using during my packet capture. The information you want to record in your spreadsheet is the name of Slot 2 for the vNIC as seen in the screenshot below.
If you have a large number of VMs and want to quickly find a specific VM, execute the following command. This is my preferred method for gathering this info.
summarize-dvfilter | grep -A 10 <vm-name>

Another method for gathering this information can be accomplished from the NSX Manager (virtual appliance). First thing you want to do is open a Putty (SSH) session with the NSX manager and then proceed with the following commands. In the output from the final ‘show vm ‘ command will be ‘Filters’. The information here should be the same from the ‘summarize-dvfilter’ output for the VM.
nsxmgr>  show cluster all
nsxmgr>  show cluster
nsxmgr>  show host
nsxmgr>  show vm
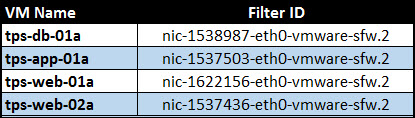
Here is a summary of the Filters for each of my virtual machines that I will be using in this exercise.
So that’s it up to this point. I do not have any firewalls created up to this point and the ‘Default Rule’ in my NSX firewall configuration is set to ALLOW. The last thing I have done is ensure everything is communicating by issuing a PING between all of my VMs. Every one of my VMs are PING’ing one another…100% success rate.
NOTE: I created a /cap directory on each of my ESXi hosts where I can temporarily store my packet capture files (.pcap).
Capture Permitted Traffic
Now we are going to capture some permitted packets and then analyze what those packets look like. I’m going to connect to my ‘tps-web-02a’ virtual machine and issue a continuous ping to my ‘tps-app-01a’ virtual machine. To summarize, the following components are going to come into play here.
- tps-web-02a
- IP Address: 10.1.13.12
- MAC Address: 00:50:56:9D:32:6F
- dvfilter: nic-1537436-eth0-vmware-sfw.2
- ESXi Host: esx-04a
- ESXi Host VTEP IP: 172.20.22.101
- ESXi Host VTEP MAC: 00:50:56:64:D6:FE
- tps-app-01a
- IP Address: 10.1.12.11
- MAC Address: 00:50:56:9D:B6:9B
- dvfilter: nic-1537503-eth0-vmware-sfw.2
- ESXi Host: esx-02a
- ESXi Host VTEP IP: 172.20.22.104
- ESXi Host VTEP MAC: 00:50:56:67:5C:DE
Okay we are ready to go!
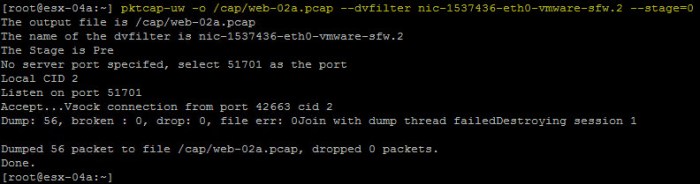
- We are starting from the source VM tps-web-02a; so I then Putty into my ESXi host ‘esx-04a.initech.local’ and issue the following command to capture the packets. Allow the command to run for about 5-10 seconds. CTRL+C will stop the packet capture.
pktcap-uw -o /cap/web-02a.pcap --dvfilter nic-1537436-eth0-vmware-sfw.2 --stage=0
- Once the packet capture is complete we want to analyze the output of the packet capture.
tcpdump-uw -enr /cap/web-02a.pcap
- Here we will find our ICMP echo request and ICMP echo reply entries. There will be multiples.
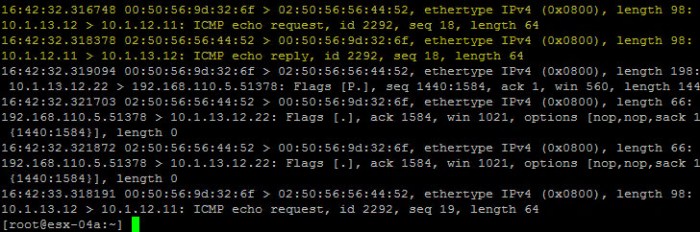
NOTE: You will notice the Layer 2 destination MAC address is not that of app-svr-01a. That is because there is a DLR between the two VMs as each is connected to its own NSX logical switch. The MAC address you are seeing there belongs to the DLR.
Very simple basic procedure that will allow you to see the data path of these packets during a successful transmission. Now we are going to complicate things a little bit by creating a DFW rule to BLOCK all traffic from the TPS web server to the TPS app servers.
Create DFW Rule to Block Traffic
Next we are going to create a very generic firewall rule in NSX to block the traffic from the TPS web servers to the TPS app servers. I simplified this by creating a dynamic Security Group using the Service Composer in NSX. Once you have your Security Groups created in Service Composer select Firewall from Networking & Security.
The following firewall rule was created. Note the Rule ID here is 1011. Keep note of this as it will come into play later on.
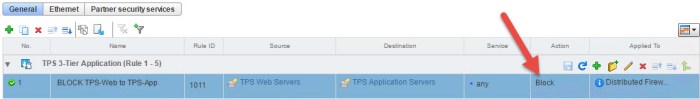
Important: Make sure of a few things. The services is set to ANY, the action is set to BLOCK and make sure the option to LOG the rule is set.
You’re finished! Next we are going to capture the BLOCKED traffic.
Capture Blocked Traffic
We are going to literally do the same steps that we did above only this time the continuous PING that we will initiate will fail 100%. If your PING does not FAIL then double check your firewall rule.
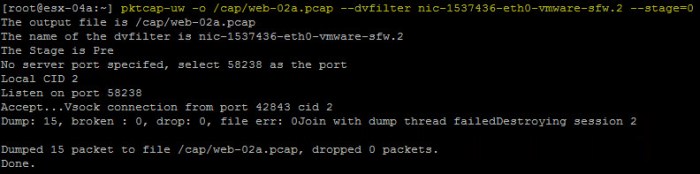
- I am going to issue a packet capture using the same command I did above. Yes I will overwrite my original packet capture file here. If you do not wish to overwrite the file simply change the name of the output file. Allow the packet capture to run for about 10 seconds. Stage 0 is for PRE (before) packets enter the switch.
pktcap-uw -o /cap/web-02a.pcap --dvfilter nic-1537436-eth0-vmware-sfw.2 --stage=0
- Once the packet capture is complete we want to analyze the output of the packet capture and view the packets.
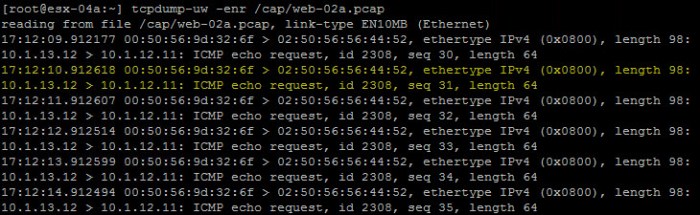
tcpdump-uw -enr /cap/web-02a.pcap
- You will immediately notice the packets that were captured are only the ICMP Echo Request packets (tps-web-02a to tps-app-01a). There will be multiple entries depending on how long you allowed your packet capture to run.
- Now we are going to execute the packet capture but we are going to modify the ‘stage’ parameter for POST. Allow the capture to run a bit longer than usual.
pktcap-uw -o /cap/web-02a-POST.pcap --dvfilter nic-1537436-eth0-vmware-sfw.2 --stage=1
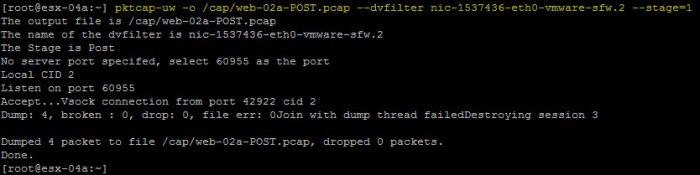
- Next we will analyze this new packet capture file.
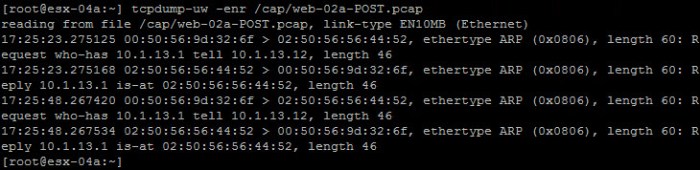
tcpdump-uw -enr /cap/web-02a-POST.pcap
- The packet capture file will be nearly BLANK. You may actually see the ARP request as seen below but nothing else that specifically indicates DROPPED packets per the DFW rule.
Analyze DFW Log Files
There is a DFW packet log file on each host. If the DFW rule is set to log the information will be entered here. The location of this log file on each ESXi host is…
/var/log/dfwpktlogs.log
My next step is to view the DROPPED information that was blocked by the DFW rule. I return to my Putty (SSH) session on the source ESXi host that is running my source VM tps-web-02a. I enter the following command to view the log file:
vi /var/log/dfwpktlogs.log
The log file will open. You probably don’t have to do this if your environment is small like my lab but type /DROP and press ENTER. This command is handy if you are logging a lot of information on your DFW rules.
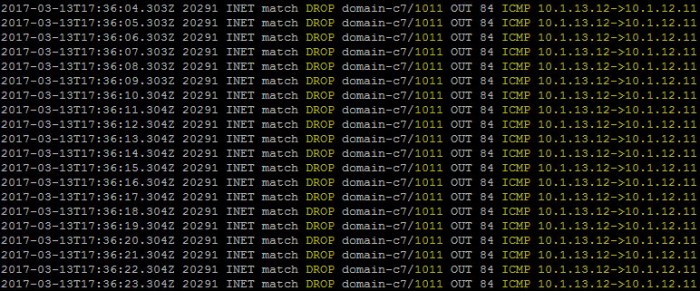
You will immediately notice the entries in the log file. You will notice DROP in the output as well as ICMP and the source -> destination TCP/IP addresses of my VMs that are attempting to communicate.
You will also notice one other piece of important information in this log entry…the 1011. This is the DFW firewall rule ID that we created. The log is specifically telling you which DFW rule is causing this packet to DROP!
Packet Capture with Default Rule Set to BLOCK
That procedure was fairly simple but lets change a few things. Here we will change the DEFAULT RULE to BLOCK all traffic and modify our custom rule to PERMIT a specific service/application.
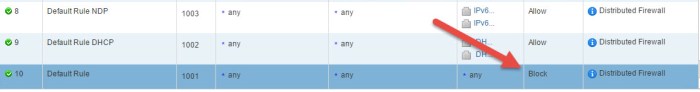
First change the Default Rule to BLOCK as seen below and choose the option to LOG.
Next we are going to modify the custom rule we created earlier (above) and configure it to allow SSH sessions from the TPS Web Servers to the TPS App Servers. I also change the name of the rule to PERMIT SSH TPS Web to TPS App
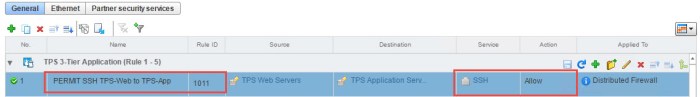
I then return to my console session with my ‘tps-web-02a’ VM and initiate a continuous PING. It should FAIL. Next initiate an SSH session from tps-web-02a to tps-app-02a. This connection should be SUCCESSFUL due to the rule I just created.
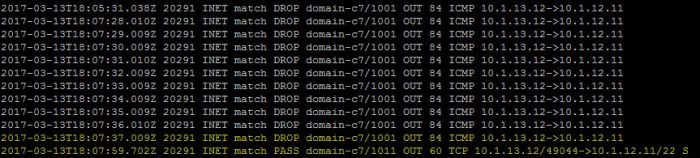
Lastly I open the ‘dftpktlogs.log’ file on the source host and view the log files. You may have to page down to the bottom to find the entries. You will now see my ICMP is being DROPPED because of the Default Rule (Rule ID 1001) now but the PASS entry now states 1011 for port 22 because my DFW rule is specifically set to Allow SSH from TPS Web Server to TPS Application Servers.
Other Useful Commands
Here are a couple other useful commands to help out with managing the DFW.
Check Policy Rules Pushed to the VM vNIC
vsipioctl getfwrules -f
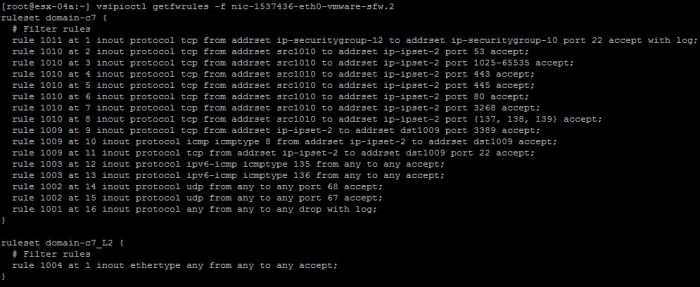
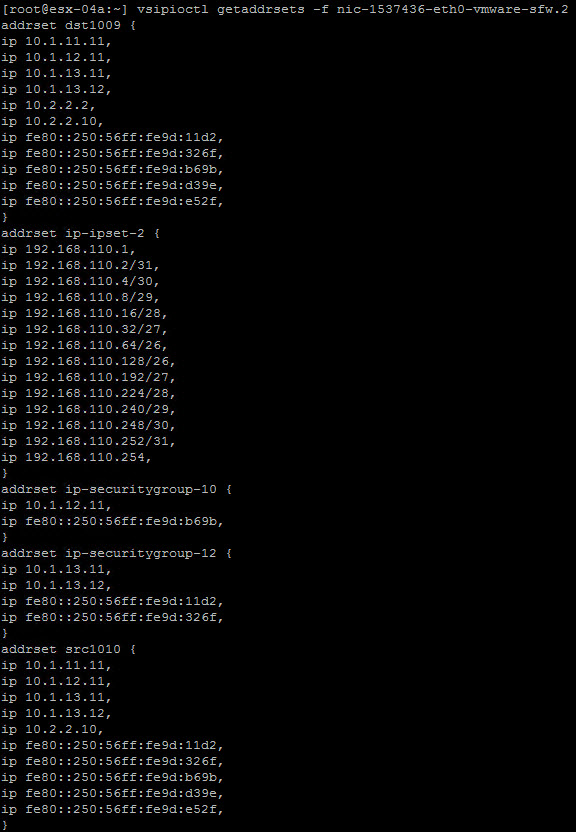
vsipioctl getaddrsets -f
Conclusion
That is all there is to it for capturing and viewing packets that are permitted or blocked by the NSX DFW. Learn this procedure and use it to enhance your NSX skill set. The more you know the easier anything becomes.
Practice this procedure and get familiar with it as much as possible it will be a very useful during troubleshooting. Every NSX admin should know how to do this or have some sort of procedure in place to use it when needed. Just remember to enable LOGGING on the rule. If the log file is empty on the host then chances are logging is not enabled. I see this happen more often than not. Once you are finished troubleshooting turn off logging.
If you want to learn more about the NSX DFW check out some out some of the useful links below.
BE SOCIALABLE…PLEASE SHARE! 🙂
Useful Links
NSX Logical Switch Packet Walk
VMware NSX Micro-segmentation Day 1 (PDF by Wade Holmes) *highly recommended*
NSX Distributed Firewall Deep Dive by Roie Ben Haim (One of my favorite bloggers)
Microsegmentation with NSX DFW (Feature Walk-through from VMware)
VMware NSX for vSphere Documentation

One thought on “NSX DFW Packet Walk”